Weekly Progress Monitoring Percentage Appears Low
Last updated: June 27, 2026
This document will show how to use other reports to locate students who are expected to be monitored in the Weekly Progress Monitoring Healthy Indicator report but aren't. The results may not be exact but are close and can assist with ensuring students are being served.
Important things to remember about the Weekly Progress Monitoring graph:
The ‘out of’ number is the number of students who scored below benchmark on the default content-area assessment for their grade level, in the most recent completed screening window.
The number of students who scored below benchmark may change, as students with scores on the appropriate default assessment move in/out of the district.
Today’s progress monitoring scores aren’t included - assessment data updates nightly.
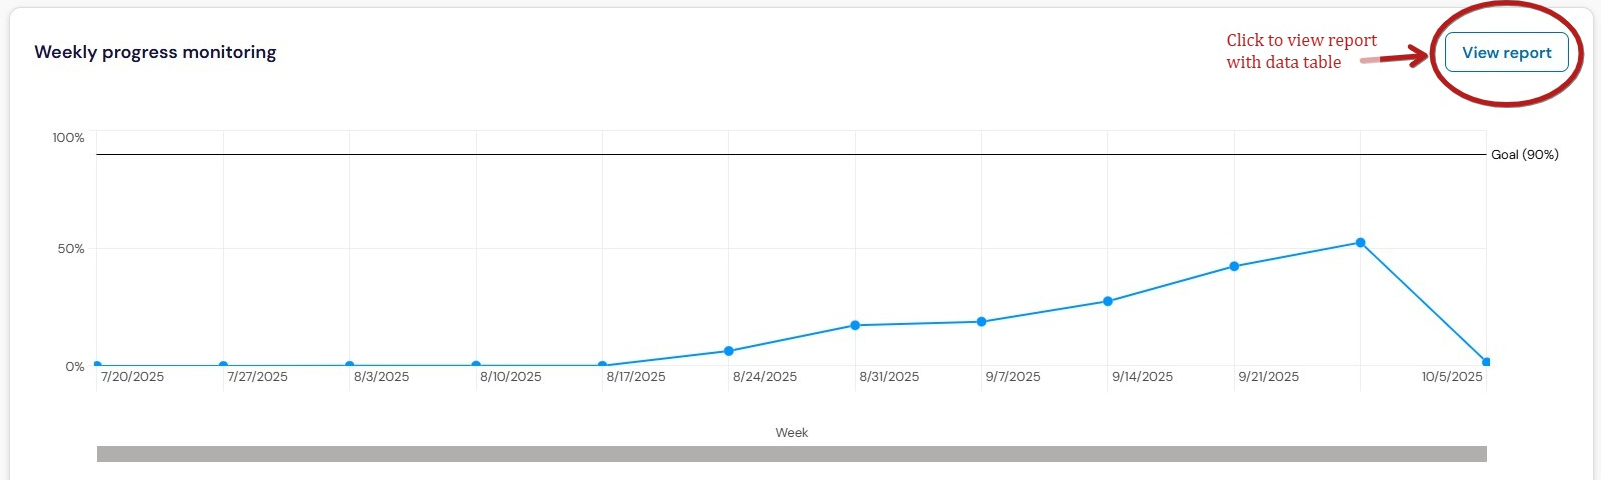
The Weekly Progress Monitoring Report graph is located on the bottom half of the ACT tab in Healthy Indicators. The blue line and data points represent school level data. Hovering over data points will display the date and percentage of students who were monitored with a content area measure out of the total number of students who were below benchmark on the most recent screening window.
Click the View Report button in the upper right to view the graph with data table.
In the report, the data table is located below the graph displays the percentage by grade level. The default screening assessment varies by grade, so the easiest way to find the students who weren’t monitored is to look at the data by grade level. You can use the table to identify grades with lower percentages to investigate.
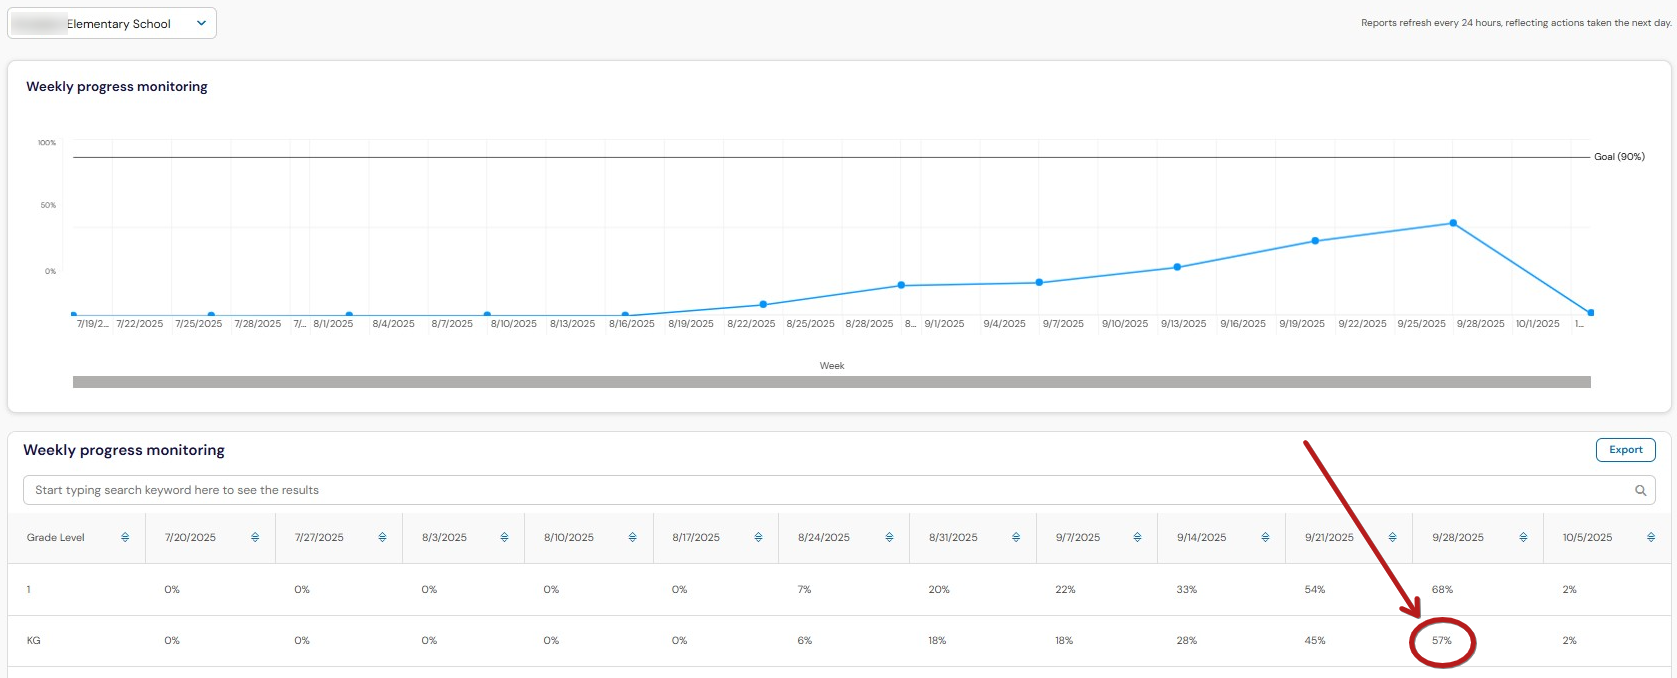
In our example above, there are a total of 57% of expected students in Kindergarten who have content area monitoring scores.
What is the purpose of the Weekly Progress Monitoring Report?
The Weekly Progress Monitoring Graph is used to view progress monitoring trends toward the Healthy Indicators on the Act tab. The intent is to monitor students frequently and consistently to ensure reliable data to make good decisions about student improvement.
The percentage of completion is low, how do I find the students who were not progress monitored?
There isn't an exact way to determine which students are missing PM according to the Weekly Progress Monitoring HI report right now, although it is something in development for the future.
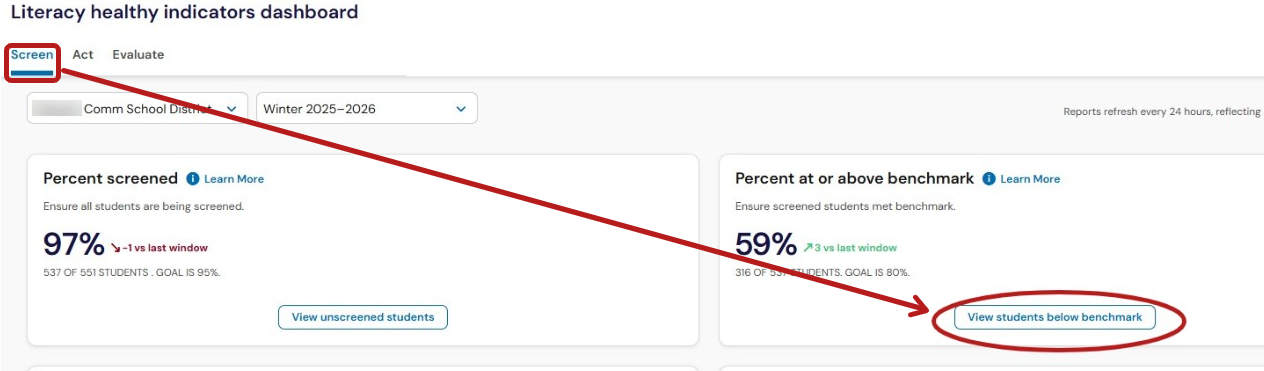
For now, the starting point is to determine which students are 'included' in the Weekly Progress Monitoring HI report. To do that, run the Students Below Benchmark report available on the Screen tab (screenshot below). The students in that report are the denominator in the Weekly Progress Monitoring report, in other words, the students that Panorama is checking for progress monitoring in the Weekly Progress Monitoring report.
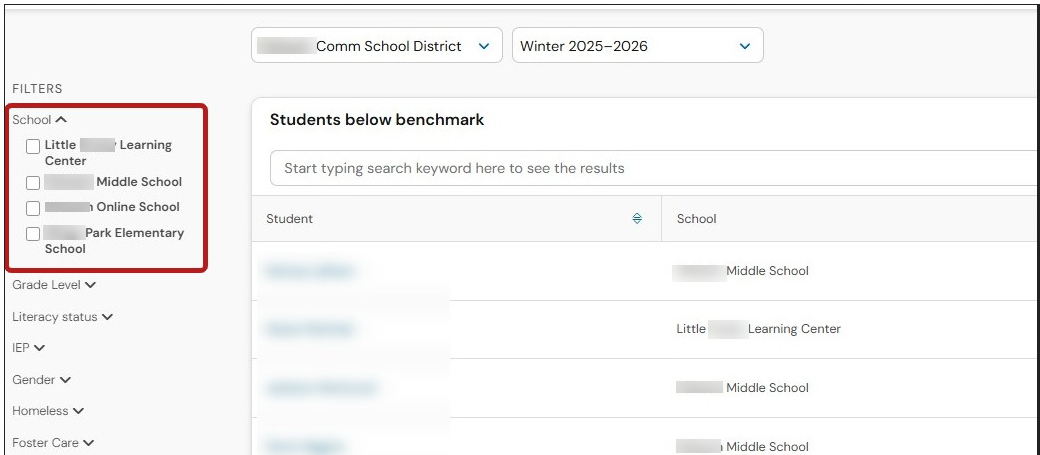
On the Students Below Benchmark report, you can also break down the view using the school filter on the left to refine the list. You can also export the list using the Export button, which can be helpful as you’re attempting to verify whether PM was completed for each student.
With that base list of who is expected to have PM according to Health Indicators, you can investigate the individual students using the data in the assessment system or in Panorama by looking at the individual student profile pages. There aren't any filters on other reports that are accurate enough to identify those who have PM in a specific area currently. Panorama recently confirmed that the progress monitoring this week/last week filters don’t adhere to an area (literacy or mathematics) so aren’t helpful for refining the list.