Tools for Interpreting myIGDIs Data in Student Success
Last updated: June 27, 2026
Color key for myIGDIs in Student Success
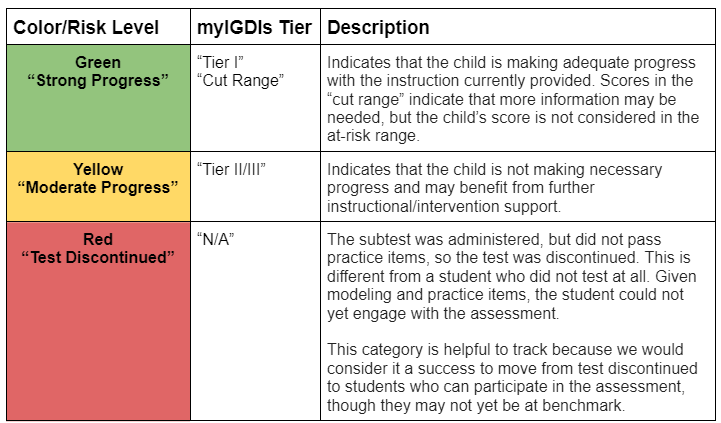
The cutpoints and color key for the myIGDIs assessment differs from the other assessments in Student Success. The table and animated examples below display the colors and meaning to support score interpretation. For more information, see myIGDIs Early Literacy Scoring and Benchmarks.
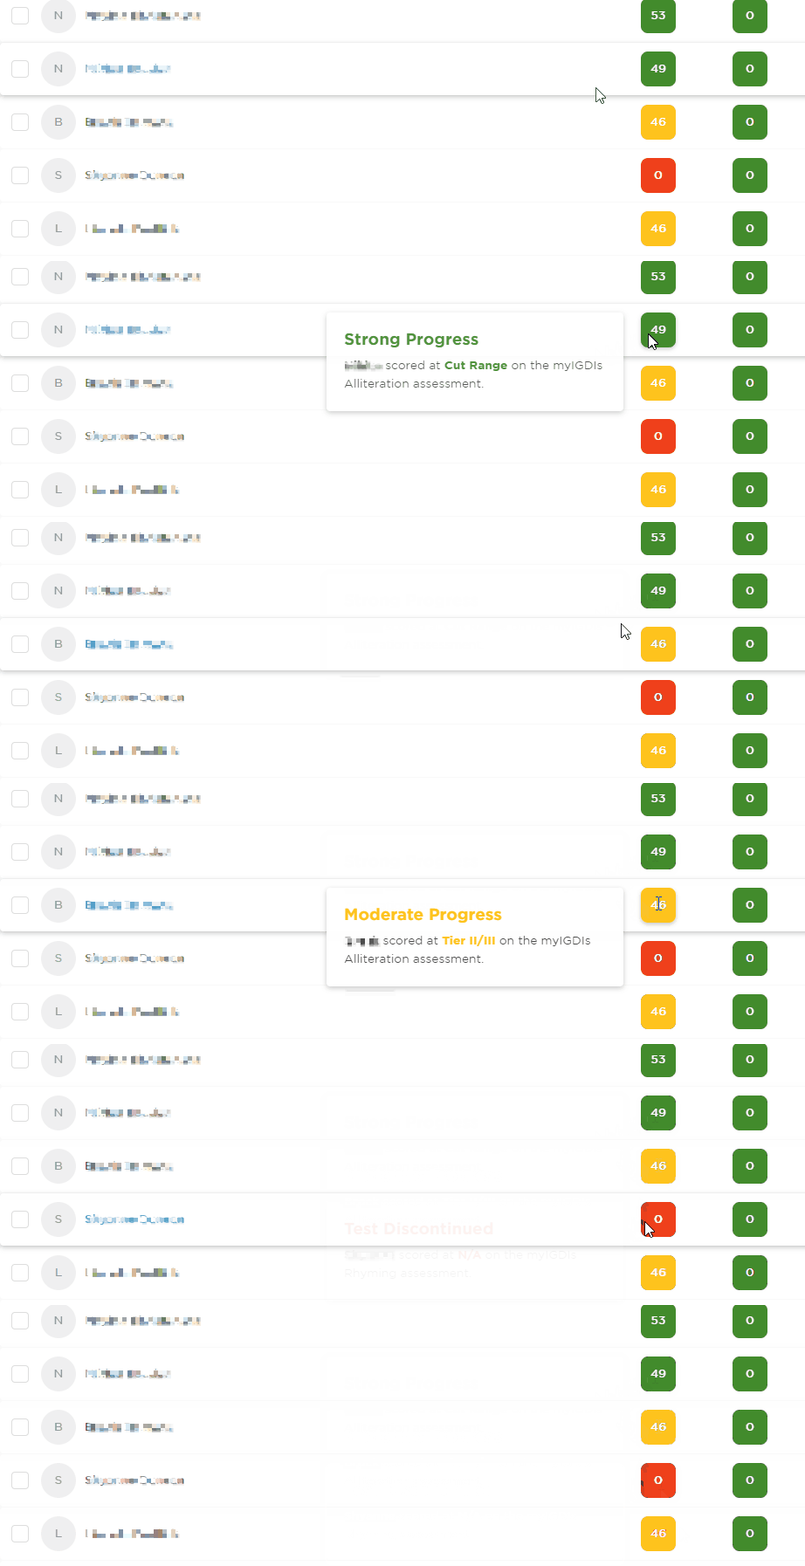
In addition to color coding, if you hover over the score on a report, the risk level and tier will be displayed, as shown below.
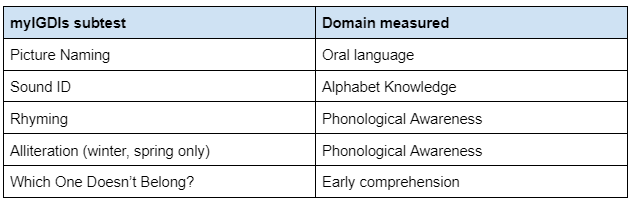
myIGDIs test and areas measured