Daily attendance dashboard replaces attendance report
Last updated: August 21, 2026
The Daily Attendance Dashboard helps your team track attendance trends at the district or school-level. You can identify students with absences and monitor progress toward attendance goals
You can use the Daily Attendance Dashboard to:
See the full picture: View district-, school-, and student-level attendance data and trends in one place.
Track progress and spot patterns: Monitor progress toward attendance goals and see where absences are concentrated. Look for patterns, such as specific schools, grades, or days with higher absences, so you can work with your team to address barriers and celebrate improvements.
Identify students who may need extra support: Look for students whose attendance patterns show they might benefit from a positive connection, outreach to them or their family, an intervention plan, or other targeted supports.
This dashboard gives you a high-level view for decision-making, while still allowing you to dig into specific details when needed.
Access the Daily Attendance Dashboard
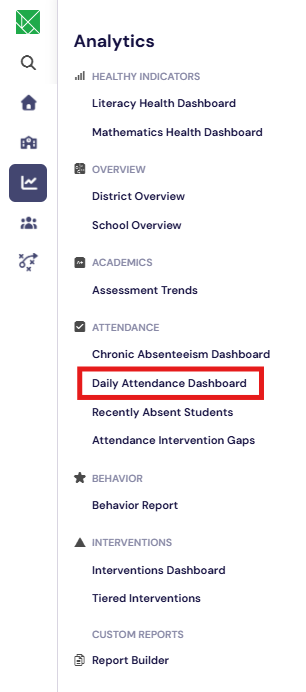
From your sidebar navigation, select Analytics and locate the Attendance section and select Daily Attendance Dashboard.
What’s Included in the Daily Attendance Dashboard
You can view this dashboard at the district or school level. The information you see will update to match whether you’re looking at the whole district or just one school.
The dashboard includes:
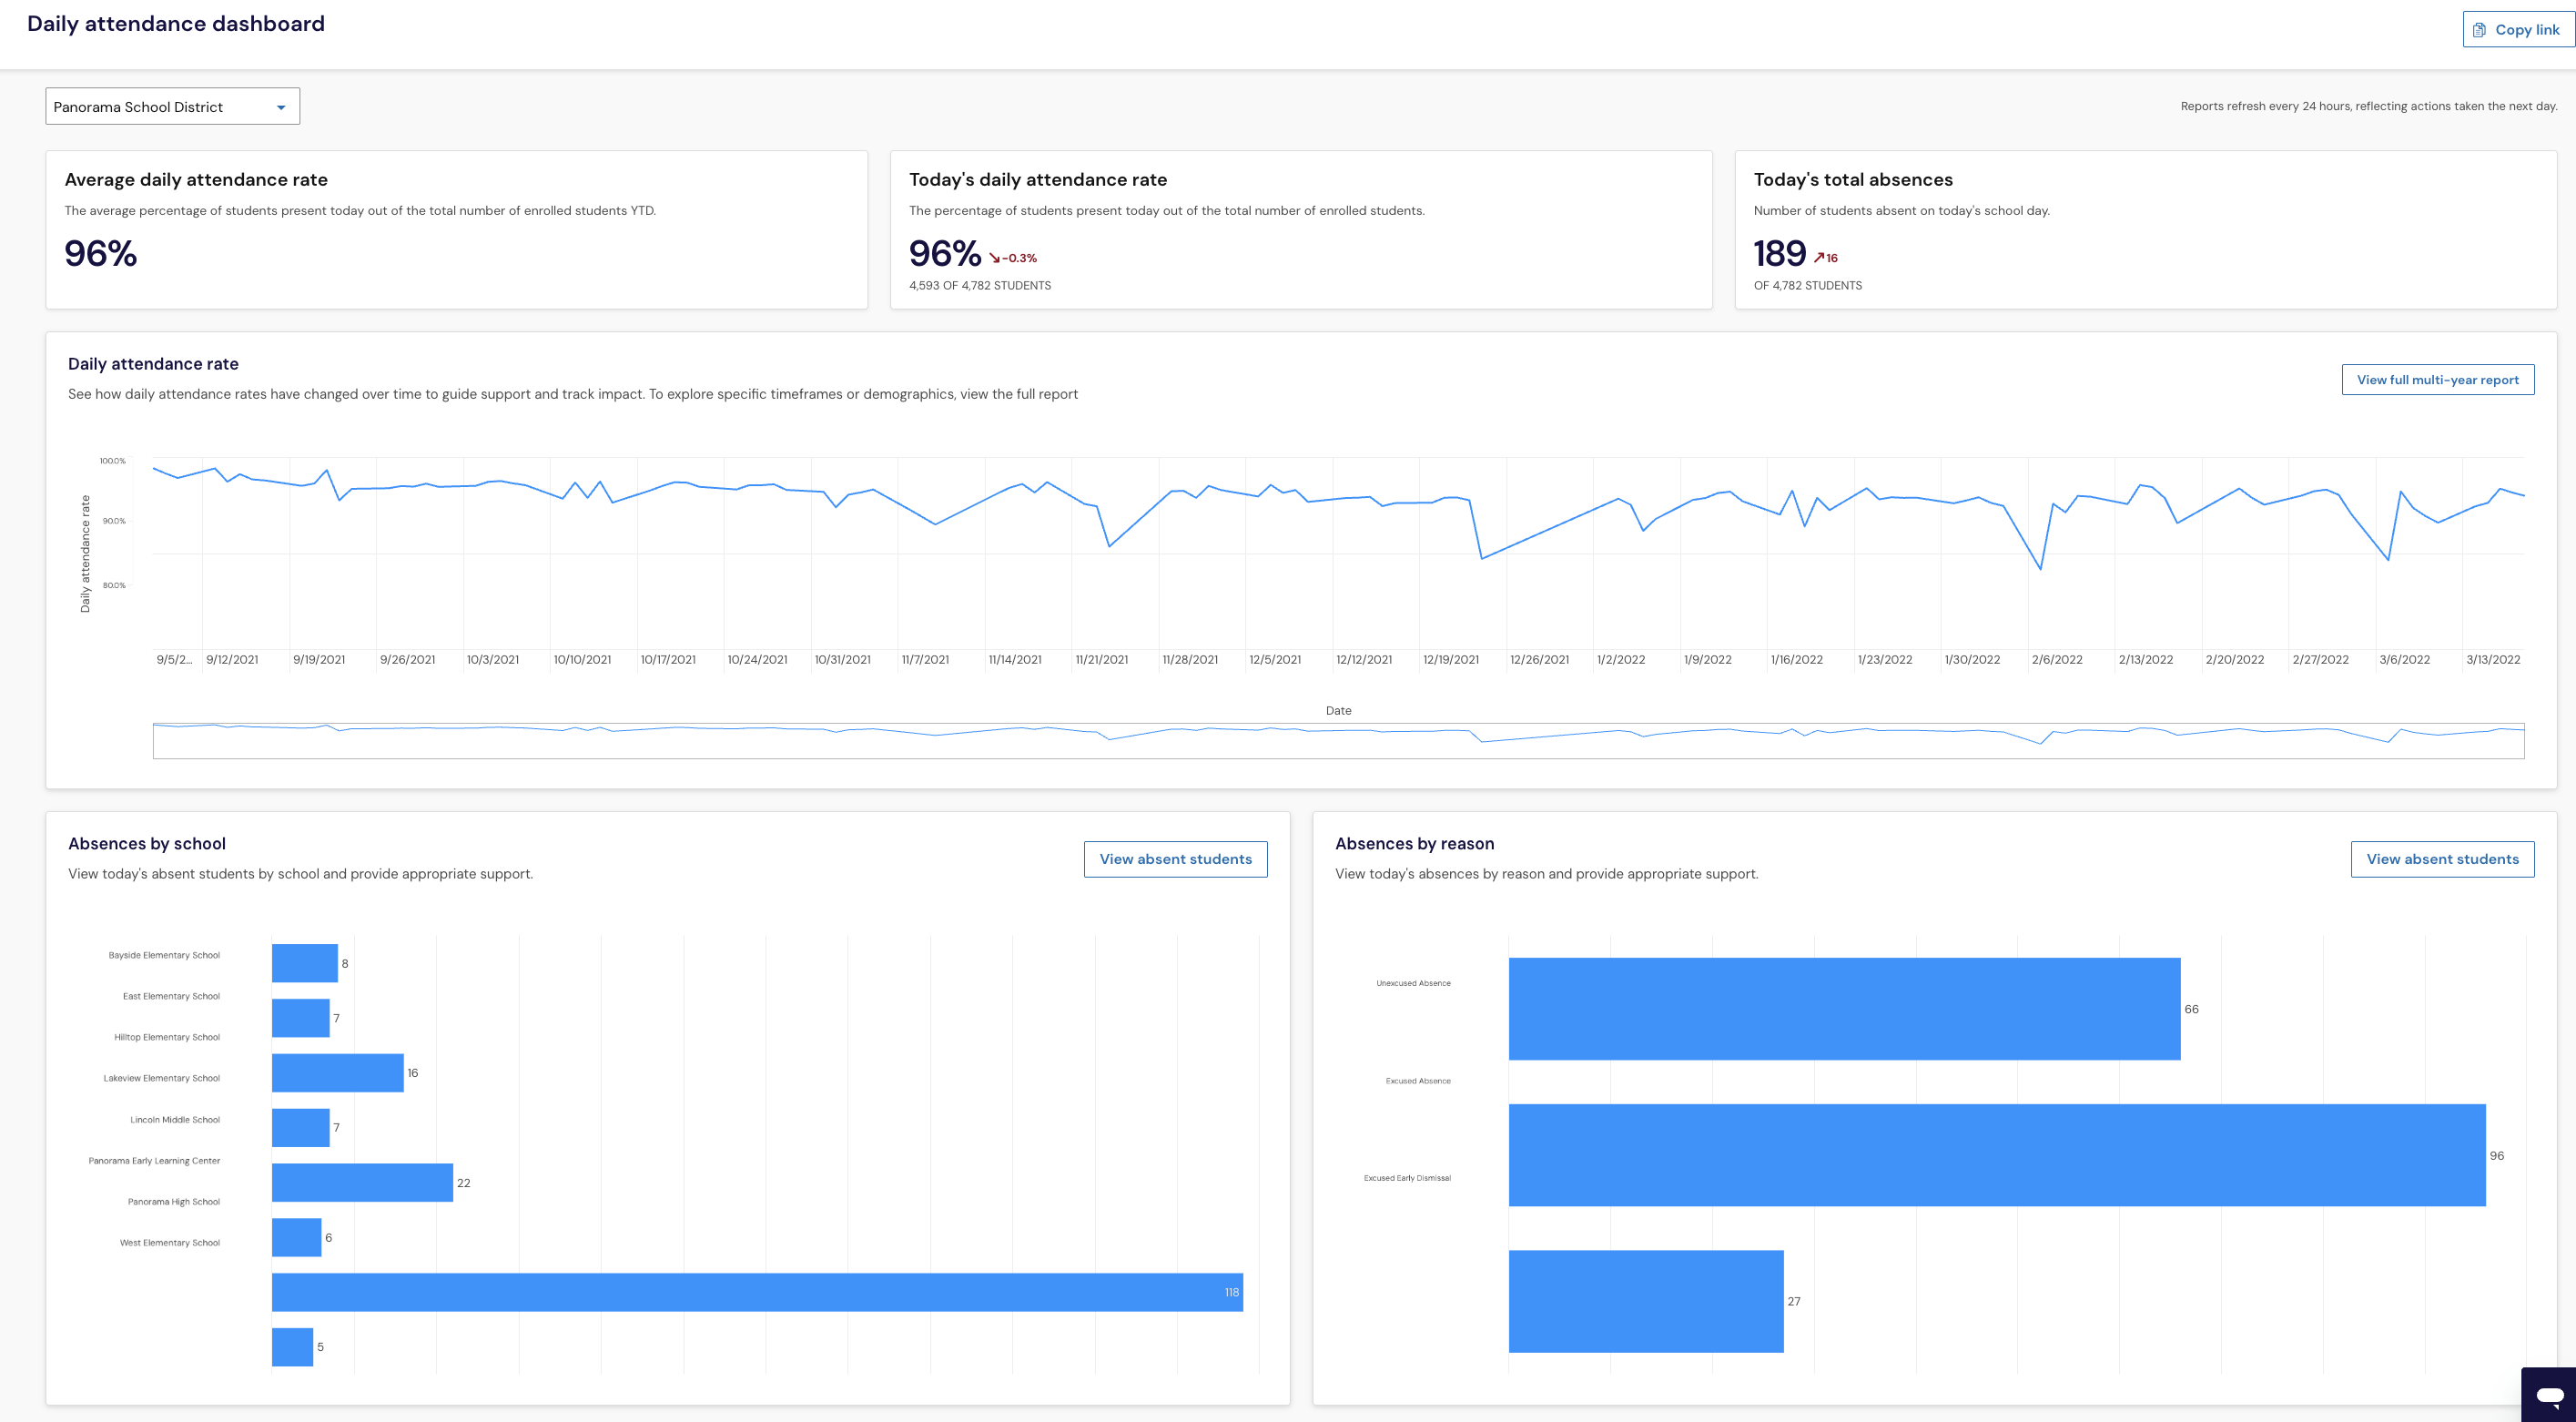
Key Metrics: Shows the average daily attendance rate, today’s attendance rate, and today’s total absences.
Average daily attendance rate: The average percentage of students present today out of the total number of enrolled students year-to-date (YTD).
Use this to track long-term patterns and measure progress toward your attendance goals.
Today’s daily attendance rate: The percentage of students present today out of the total number of enrolled students.
Use this to monitor day-to-day changes and respond quickly if attendance drops.
Today’s total absences: Number of students absent on today’s school day.
Use this to see the scale of current absences and prioritize outreach or support.

Daily Attendance Trends Report (Longitudinal Attendance Data)
This longitudinal view of daily attendance helps you and your team understand how attendance patterns change over time across schools or student groups within a district. By using a heat map and trend views together, this report supports pattern recognition rather than one-time comparisons.
With this report, you can:
Track daily attendance patterns over multiple time periods, such as months or seasons, to see how attendance shifts over time
Compare schools or groups within the district during the same time period to understand how attendance varies across contexts
Identify patterns that may warrant deeper inquiry, such as sustained dips, improvements, or differences across schools or groups
This view is designed to help teams focus on where to look more closely and guide follow-up conversations using additional context and data.
Understanding Absence Trends
Understanding where absences are happening most often can help you focus your attention and resources where they’ll have the biggest impact. The dashboard includes charts that break down absences so you can see patterns at a glance.
Absences data: Charts showing where absences are concentrated by school/grade or by reason.
District view: Displays absences by school and by reason.
School view: Displays absences by grade and by reason.
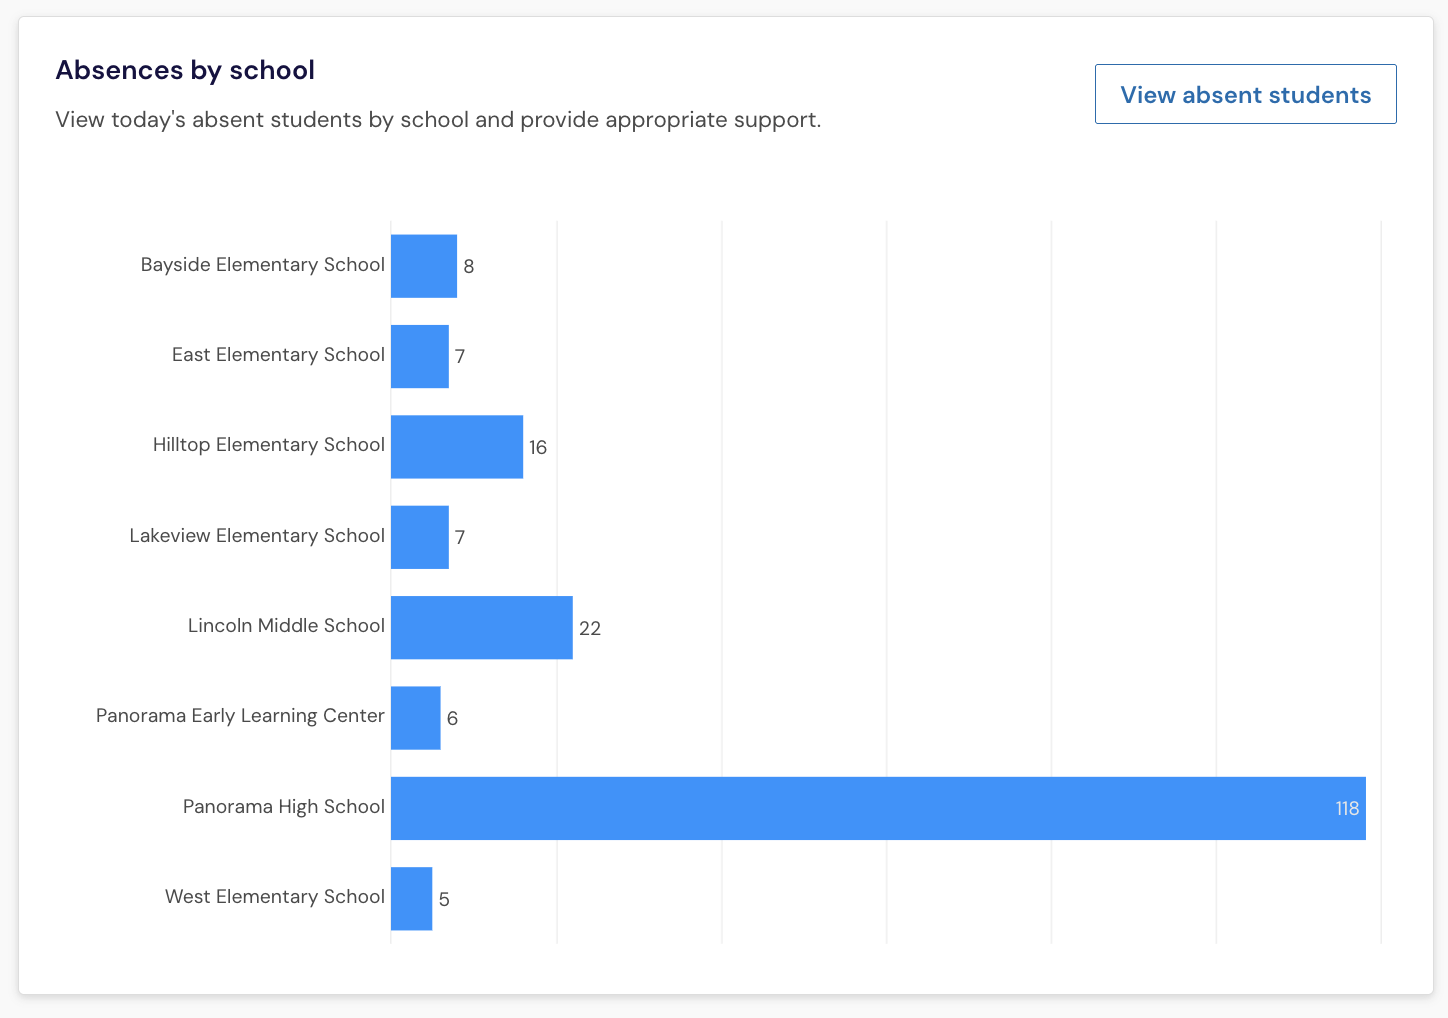
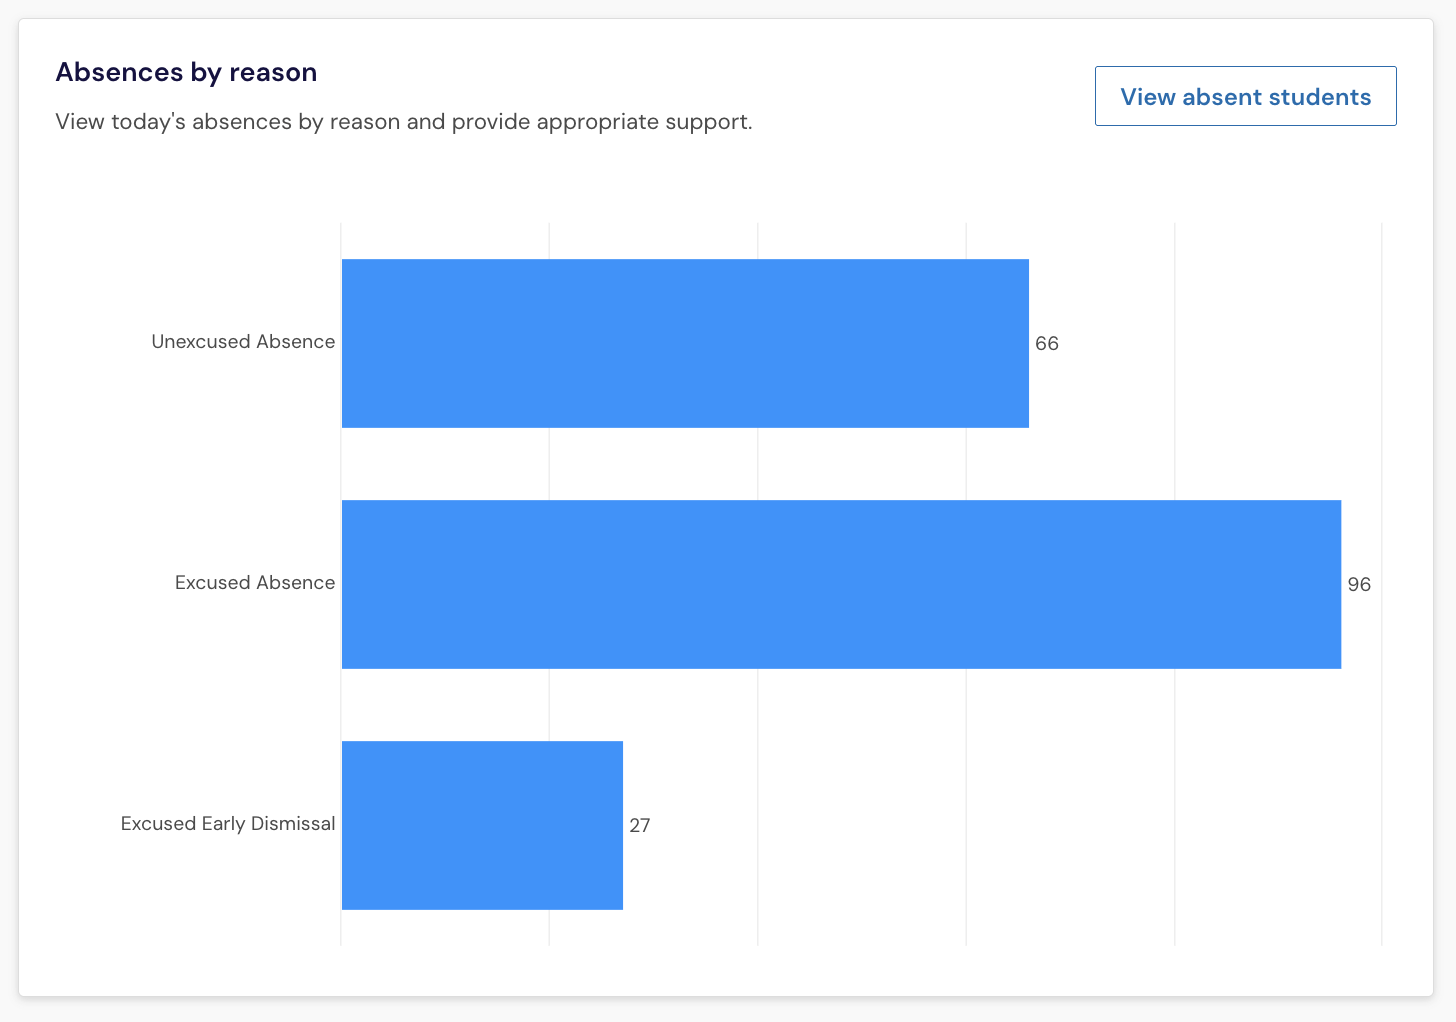
In either of the charts, in the top right corner, you have the option to select View absent students to see a list of all students absent on the given day.
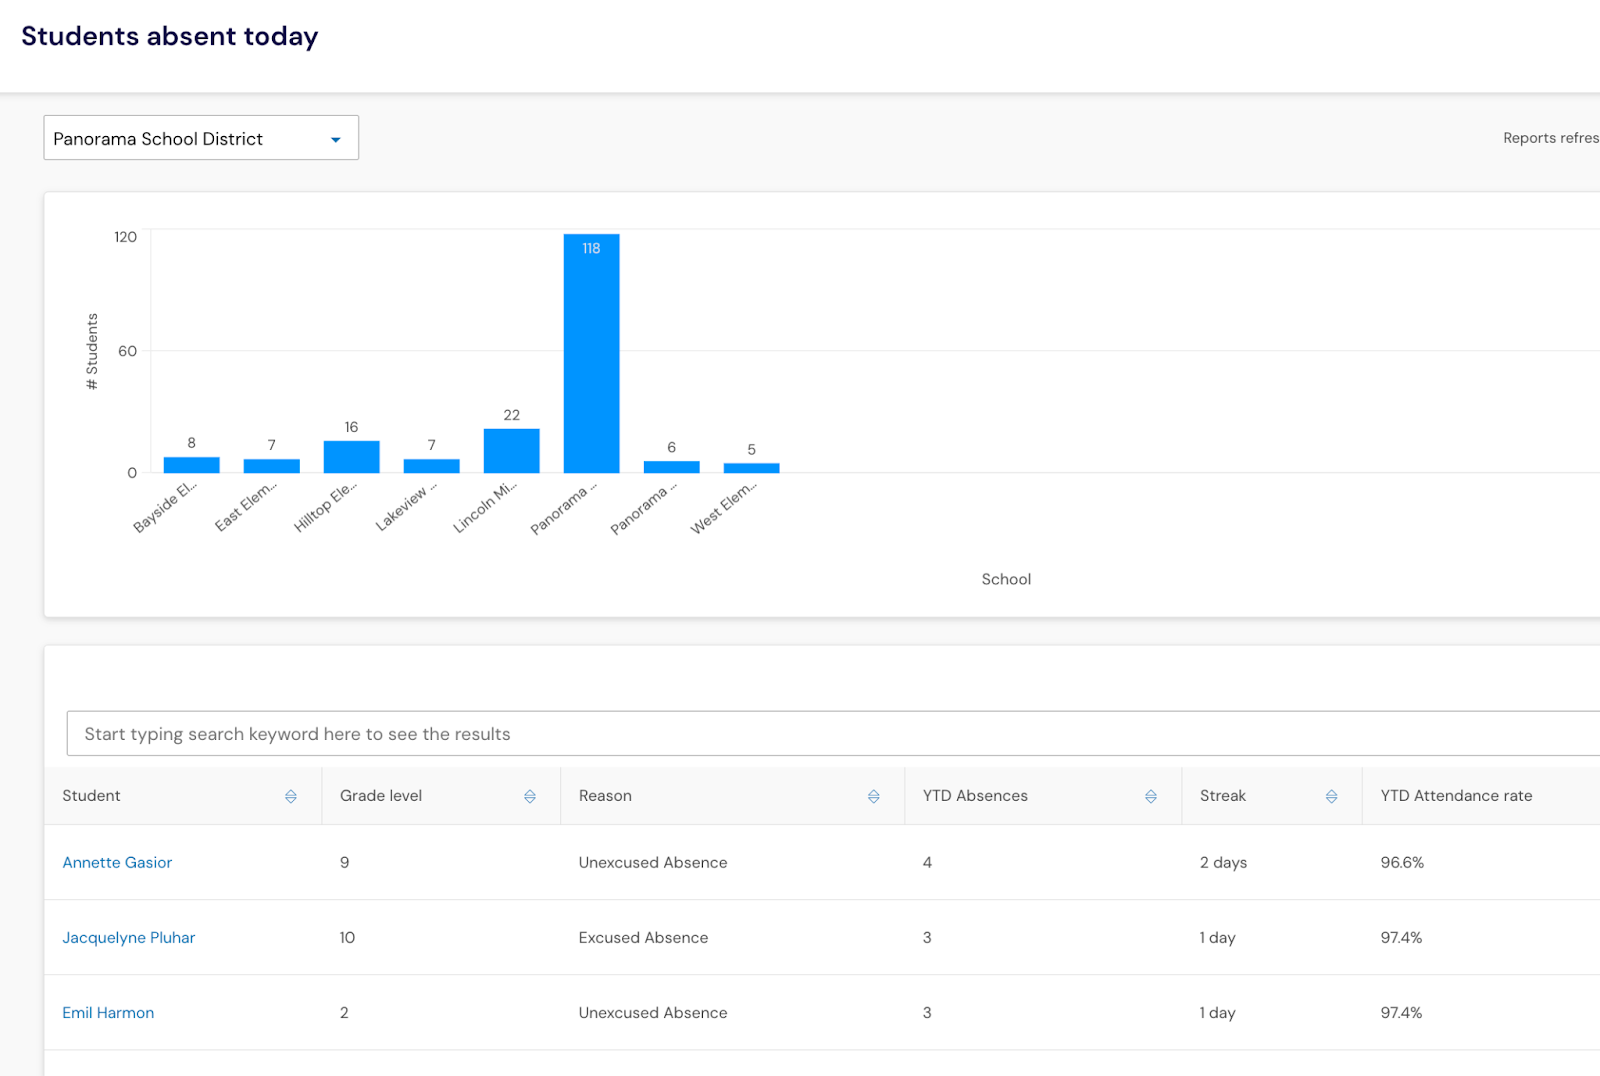
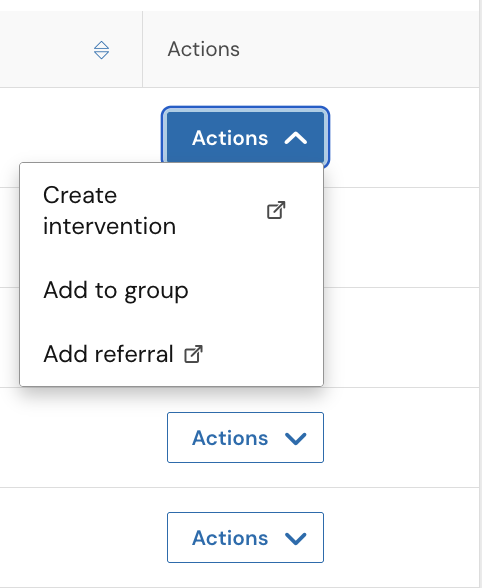
For each student you have the option to take one of the following actions:
Create intervention
Add to group
Add referral