Using Healthy Indicator Report: Percent improving with intervention (previously HI #2)
Last updated: October 23, 2026
Overview of the Healthy Indicator: Percent improving with intervention (known as HI #2)
Before you use a Healthy Indicator Report to examine your system, it’s important to know what you’re looking at. Understanding what question(s) the report is designed to answer and what data are displayed is essential to data-based decision-making. The percent improving with intervention report is designed to answer the question: Are the interventions we have set up for students who are persistently-at-risk closing the gap relative to the goal?
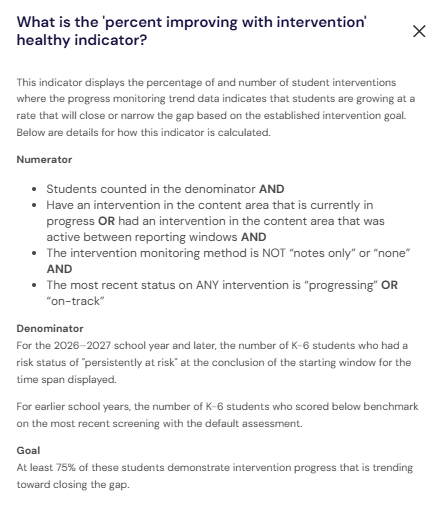
This indicator displays the percentage and number of content-area interventions for persistently-at-risk students where the progress monitoring trend data indicates that students are improving at a rate that will close or narrow the gap with the established intervention goal. The report is located on the Literacy and Mathematics health dashboards on the Act tab and can be viewed at the district and school levels. For the purpose of this document, we’ll examine the school-level report.
The span of time displayed on the current report is located in the upper left above the report. In the example below, the time span is Winter to Spring. This means the data on the report displayed is from the day after the Winter screening window closed through the day before the Spring screening window started. To view previous time spans, click the box and change the selection.
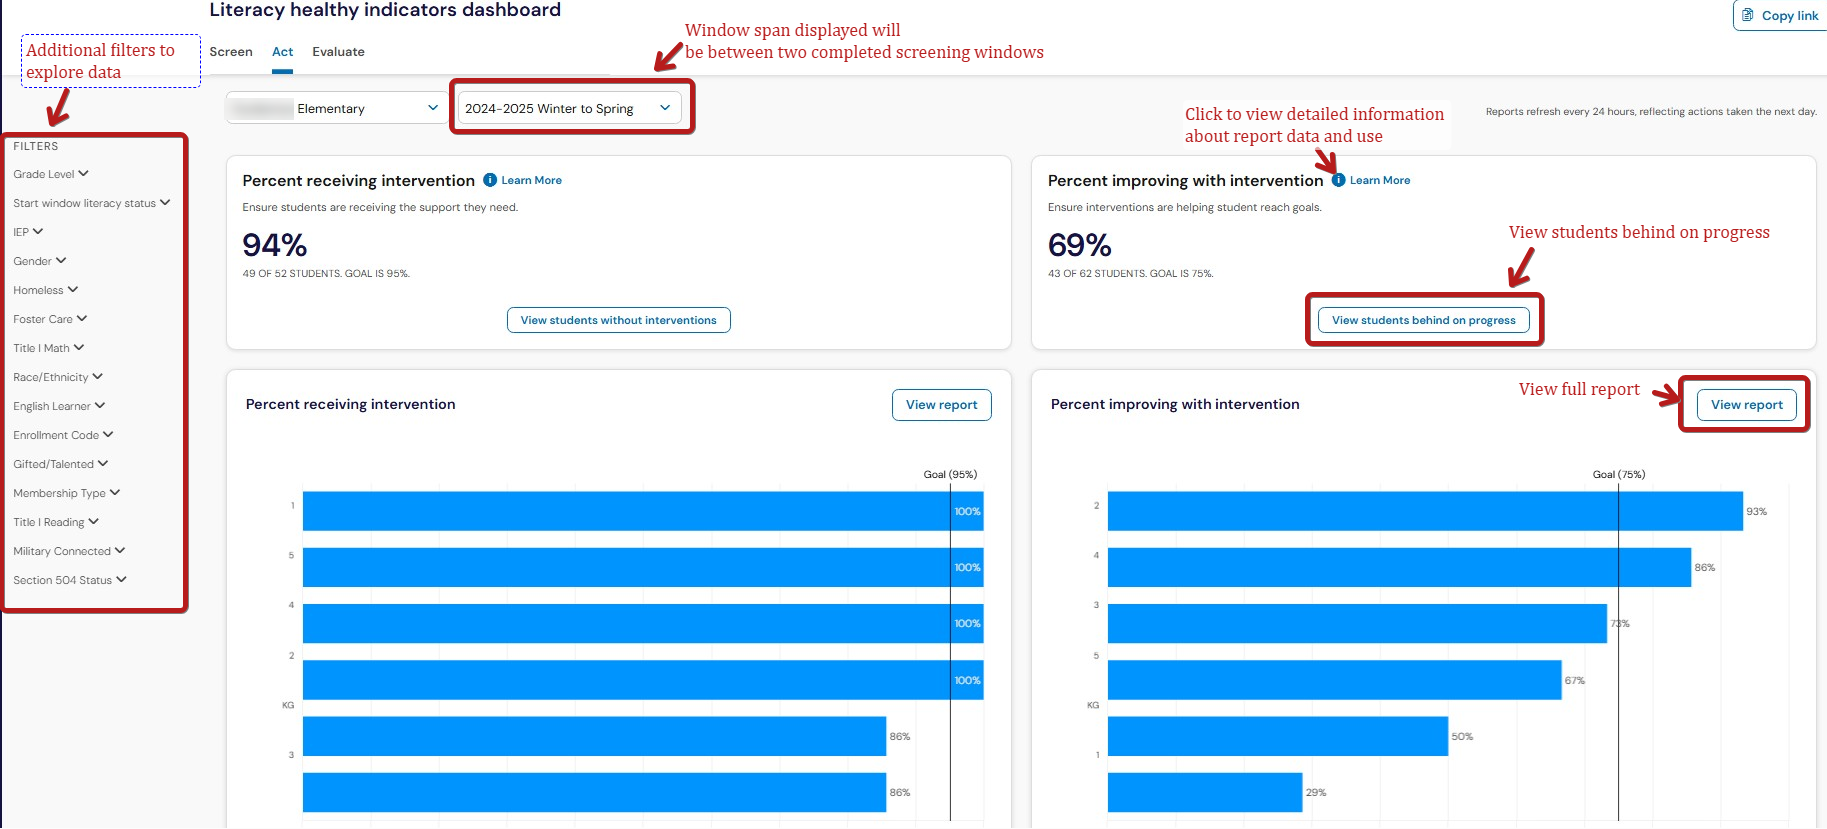
By default, the report will display the most recent span between screening windows, with the exception of the beginning of the school year when it will show the previous winter to spring window. Spring-to-fall window data would not be actionable, since school is not in session during the summer.
To view the report definition, which includes what the report is intended to do, what data is used and how the calculations are made, as well as the goal, click the blue Learn More next to the report title.
Using this HI report at the school level
A healthy school periodically reviews progress monitoring data for student interventions and makes the necessary adjustments to alter or replace the intervention if the progress monitoring trend does not show that the student is closing the gap toward the established goal. They also make adjustments when there is limited or no monitoring data available to evaluate student growth.
With that information, there are two avenues of action. One is to make sure that students needing progress monitoring are being tested. The other is to explore and remediate any beliefs or roadblocks that are in the way of regular progress monitoring. A common roadblock is the necessity to monitor more than 20% of students. An MTSS framework for weekly monitoring is sustainable based on the universal tier of instruction meeting the needs of 80% or more of students. While increasing the monitoring for students who need it, regardless of percentage, it may be wise to examine the universal tier of instruction at the same time.