Using Healthy Indicator Report Percent Receiving Intervention (formerly HI 5)
Last updated: June 30, 2026
📊Update on ACT tab HI report data issue 12/8/25 update: All known issues with Healthy Indicator reports have been resolved. If you encounter any issues, please contact support_iowa@panoramaed.com with details to investigate. |
Overview of the K-6 Percent Receiving Intervention Report (formerly known as HI #5)
Understanding what question(s) a report is designed to answer and what data are displayed is essential to data-based decision-making using the Healthy Indicator reports. The Percent Receiving Intervention report was designed to answer the question: Are we providing interventions for students who need them?
The Percent Receiving Intervention report is located on the Literacy or Mathematics Healthy Indicators Dashboard on the Act tab and can be viewed at the state, AEA, district, and school levels. For this document, we’ll examine the school level literacy report.
The span of time displayed on the current report is located in the upper left corner above the report. In the example below, the time span is Winter to Spring. This means the data on the report displayed is from the day after the Winter screening window closed through the day before the Spring screening window started. To view previous time spans, click the box and change the selection.
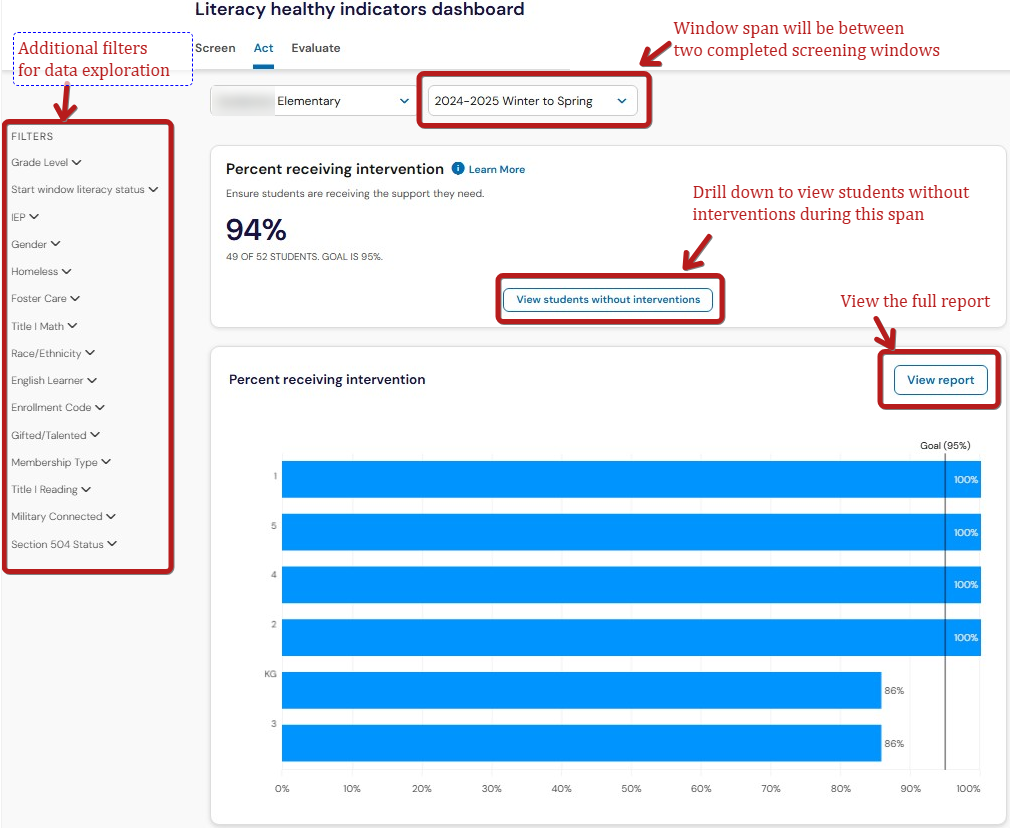
By default, the report will display the most recent span between screening windows, with the exception of the beginning of the school year when it will show the previous winter to spring window. Spring to fall window data would not be actionable, since school is not in session during the summer.
To view the report definition, which includes what the report is intended to do, what data is used and how the calculations are made, as well as the goal, click the blue Learn More next to the report title.
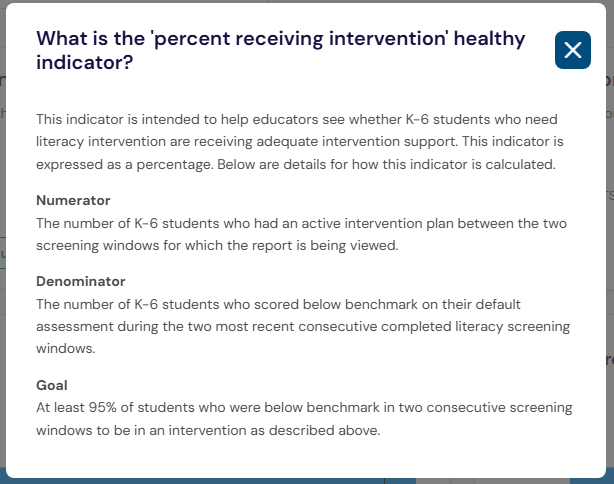
For the Percent Receiving Interventions report, Student Success identifies students who had a "Persistently At-Risk" status at the conclusion of the starting window for which the report is being viewed. Then it looks for an active intervention plan (either group or individual) for those students and uses that information to calculate the percentage of those who are required to receive an intervention. Interventions that are marked past due or future dated during the report span are not counted.
Remember, interventions do not transfer from FastBridge to Student Success, so the system is only tracking interventions that are entered directly in Student Success.
Using the Percent Receiving Interventions Report Data - School Level
The idea behind this report is that students who have a history of being below benchmark need intervention to be successful, and interventions should be actively monitored for effectiveness. A “set it and forget it” approach to interventions may comply with ELI or Math Counts requirements; however, the intent is to select and implement interventions matched to a students’ needs and utilize best practices for monitoring effectiveness. Progress monitoring data should be reviewed routinely to confirm whether the intervention is having the desired effect. Ineffective interventions should be adapted, intensified, or replaced.
Navigating the Report
Hover over the bar to view the number of students with active interventions out of the total number who had a "Persistently At-Risk" status at the conclusion of the starting window for which the report is being viewed.
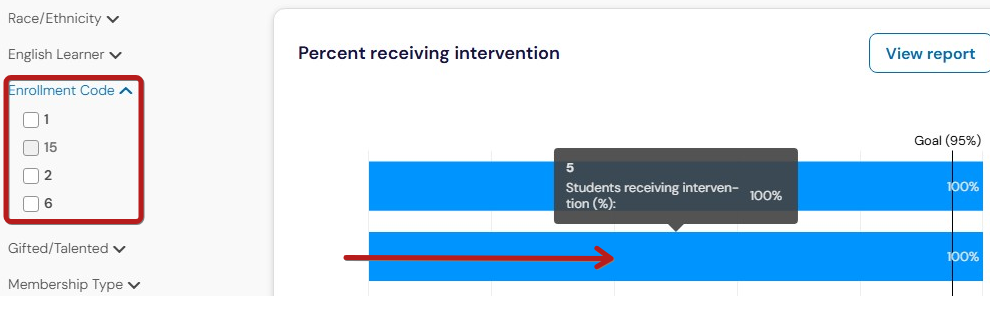
Use Filters on the left menu to check for patterns of missing or inactive interventions that may indicate the need for attention. See instructions in the section below for details.