Check out the new Beta Student Profile Page
Last updated: June 30, 2026
The Student Profile page helps you see each student's full picture in one place, bringing together their strengths, growth areas, and recent progress so you can spot patterns and plan meaningful next steps like instructional planning, MTSS meetings, and family conversations.
At the end of April, Iowa educators will have the opportunity to use the updated Student Profile page, which will be available as an opt-in beta, to review student data and coordinate support. Users will be able to toggle to the classic Student Profile view until July. This article focuses on the purpose and meaning of each section so you can apply it as the interface evolves and more information about Iowa-specific functions become available.
Accessing the Student Profile Page
You can access the Student Profile page many ways, but the top two options are:
Select Find Student in the top right corner navigation and enter a student’s name in the search bar. When it appears, click on the student's name. This will lead you directly to that student’s profile page.
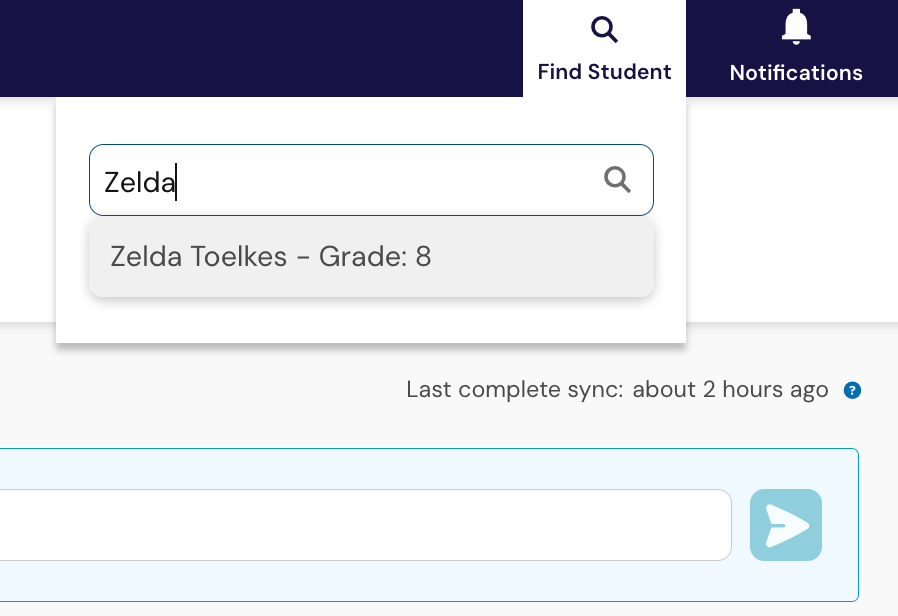
Figure 1
On the home page, select the Students overview link in the Student’s tile or the Students & Supports menu on the left side, when not on the home page. If you have access to more than one school, select the school you want to view. Click on a student’s name in the list to open the Student Profile page.
On the home page, select the Students overview link in the Student’s tile or the Students & Supports menu on the left side, when not on the home page. If you have access to more than one school, select the school you want to view.
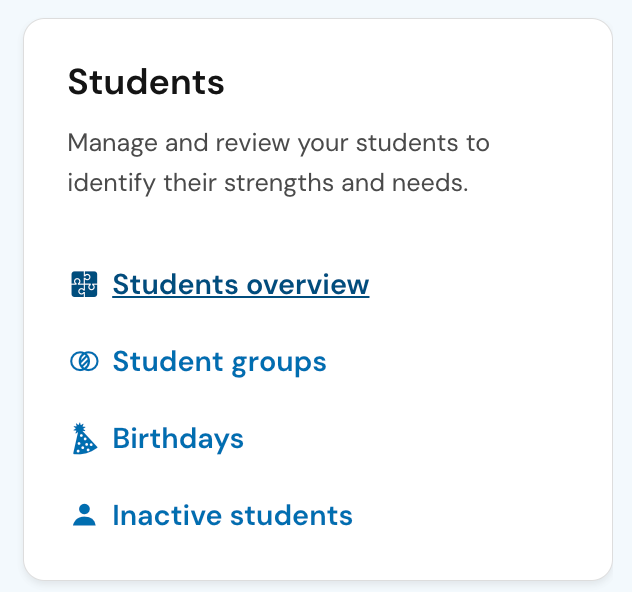
Figure 2
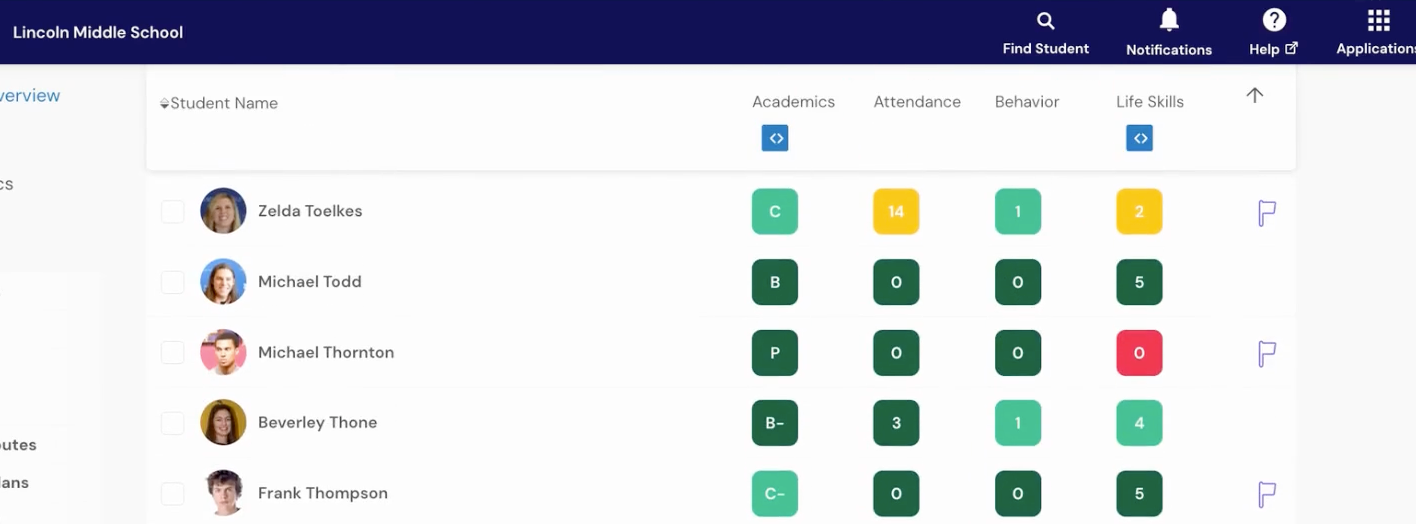
Figure 3
Switching to and from the new Student Profile view
The Student Profile page currently includes both a legacy view and a new, updated view. You can switch between them at any time.
By default, the page opens in the legacy view.
To switch to the new Student Profile, select Explore the new student profile at the top of the page.
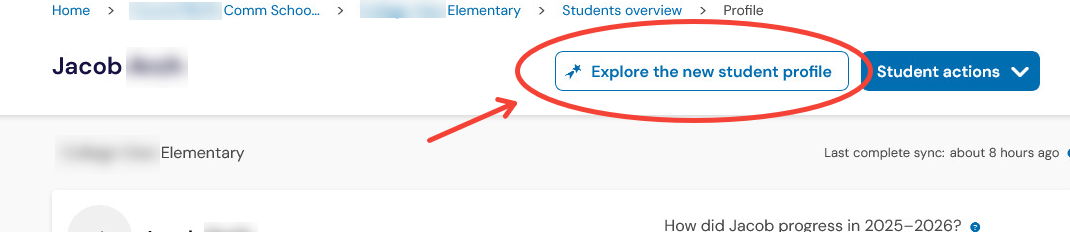
Figure 4
To return to the legacy view, select Back to legacy view at the top of the page.
Student Overview and Progress Indicators
At the top of the Student Profile, you will see a school year selector to the right when historical data is available as well as key information for the student you have selected. This includes:
The student’s demographic information from your school’s student information system (SIS).
The student's grade level and graduating class.
The time since the platform's last sync with your school’s student information system (SIS) and assessment platform..
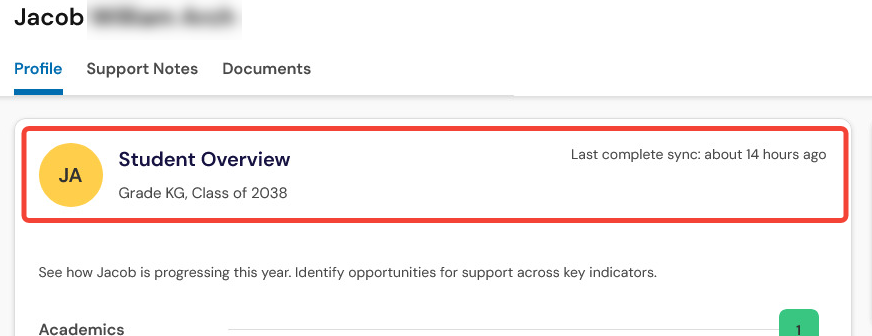
Figure 5
Progress Indicators
Below this information, the Indicator Status Summary shows a visual summary of the student’s progress across key areas, including academics, attendance, behavior.
Indicators are year-to-date.
Each indicator reflects the data available for that time frame.
A gray indicator means no data is available.
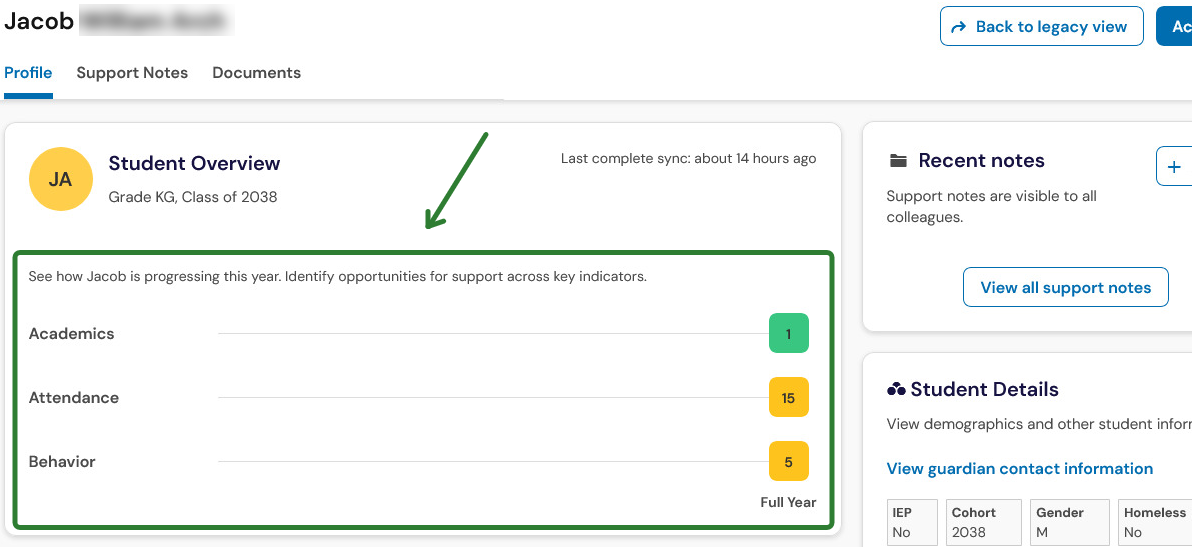
Figure 6
Hovering over an indicator shows a brief description of what it represents.
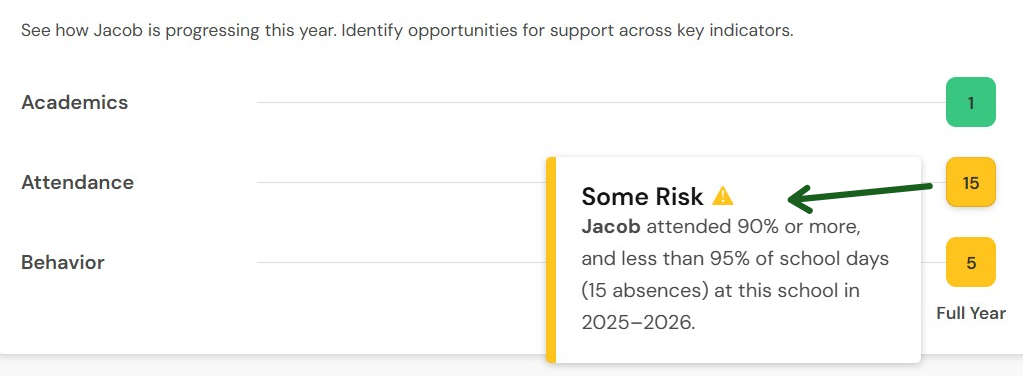
Figure 7
Support Notes and Documents
The student’s profile page includes several sections that help you review supports and information shared about the student.
Support Notes
Support notes allow educators to share observations and updates about a student. All team members who have access to see the student's profile can review these notes to understand context and coordinate next steps. There are two locations to access support notes.
Next to the Student Overview section, you will see a panel that displays recent support notes logged for the student. You can also click on the View all support notes button or the Support Notes tab at the top of the page to get a more detailed list of all the support notes that have been logged for that student.
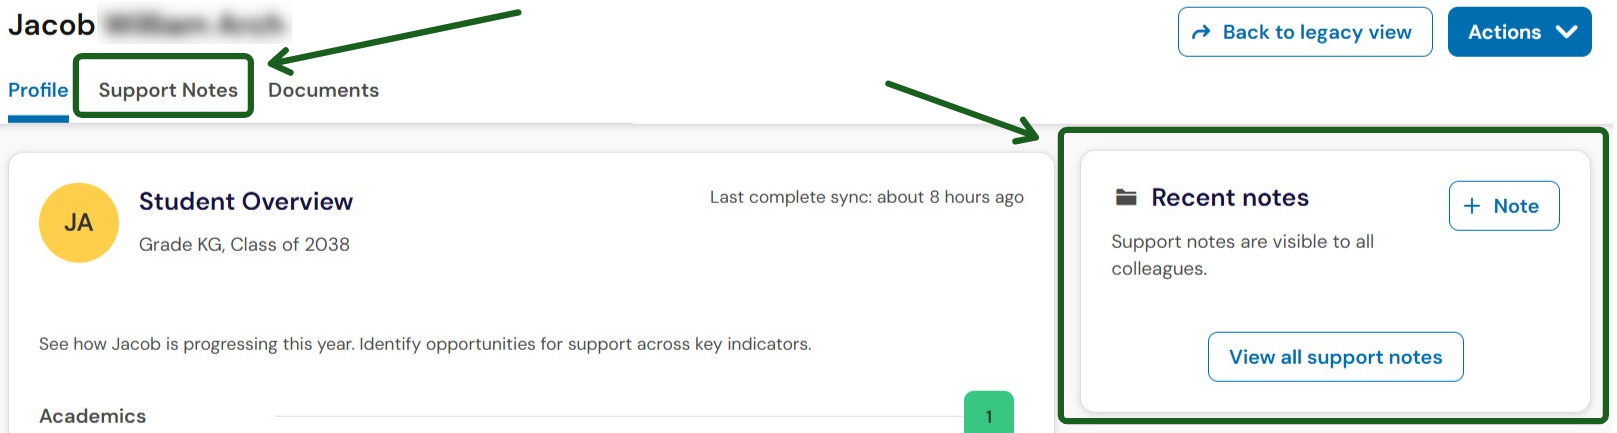
Figure 8
To add a support note, you can do so anytime by clicking the Actions button on the top bar of the student profile and select "Add support note" from the dropdown menu.
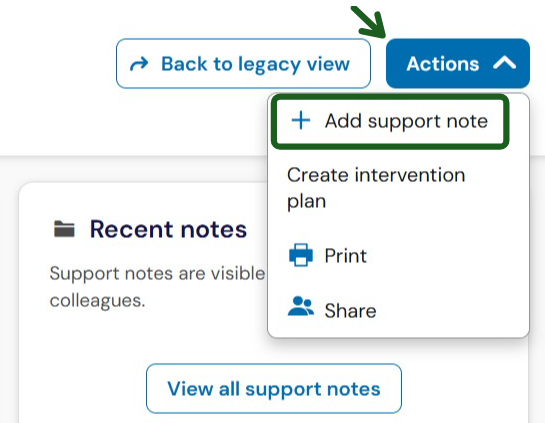
Figure 9
Documents
Documents allow educators to upload and store files that are not connected to nightly data integrations, such as plans or historical records. Keeping documents here helps teams find important information in one place.
You can access documents associated with a student by clicking on the Documents tab at the top of their profile.
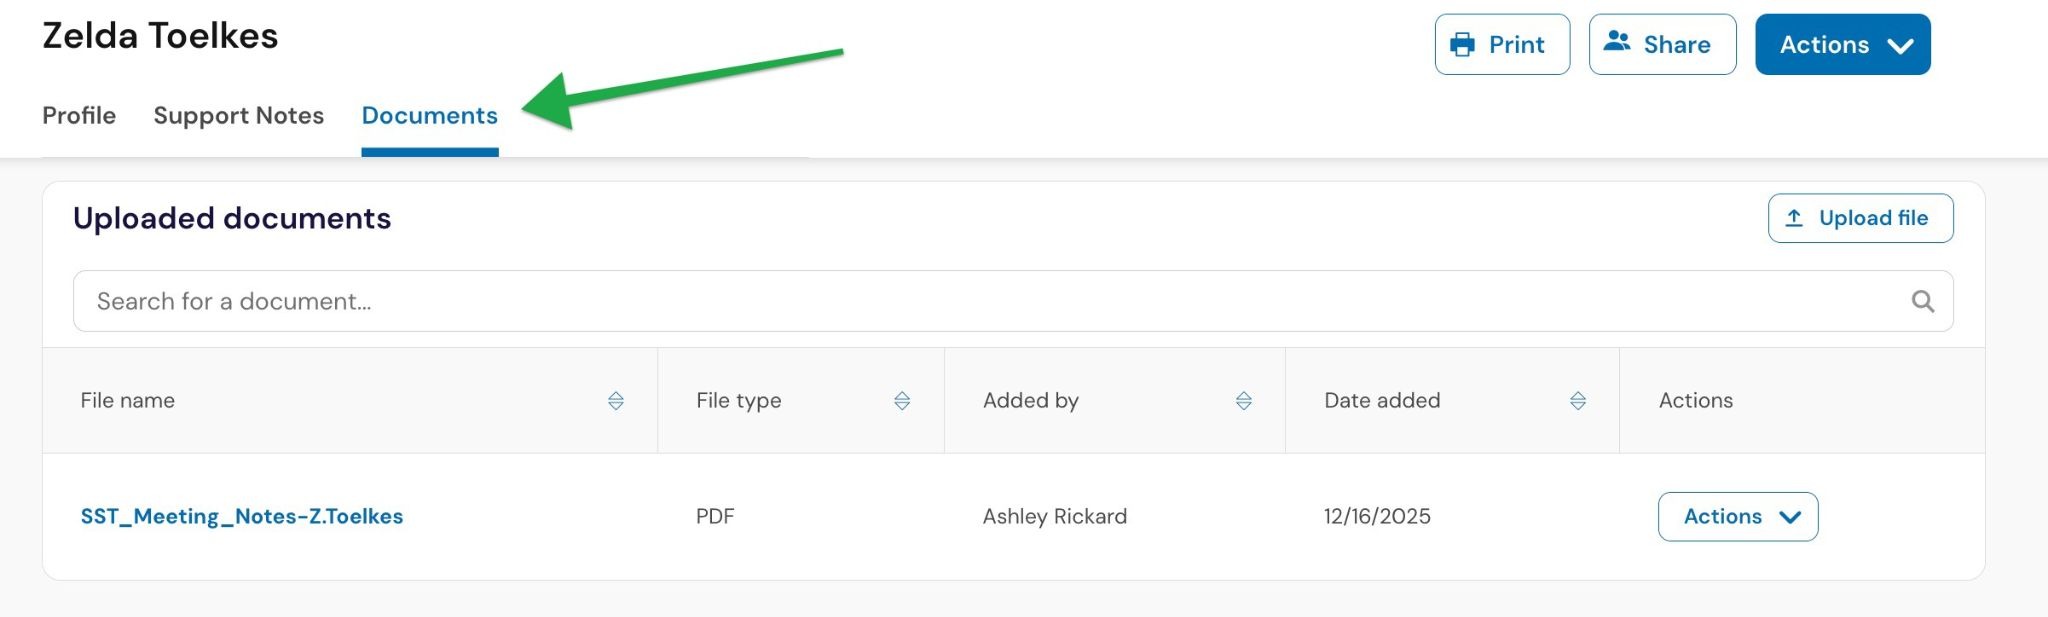
Figure 10
Student Details
Below the Support Notes section, you will see the Student Details section. Here you will see detailed information for the student you have selected. This includes demographic information from your Student Information System (SIS) and risk status for both mathematics and literacy (not pictured below).
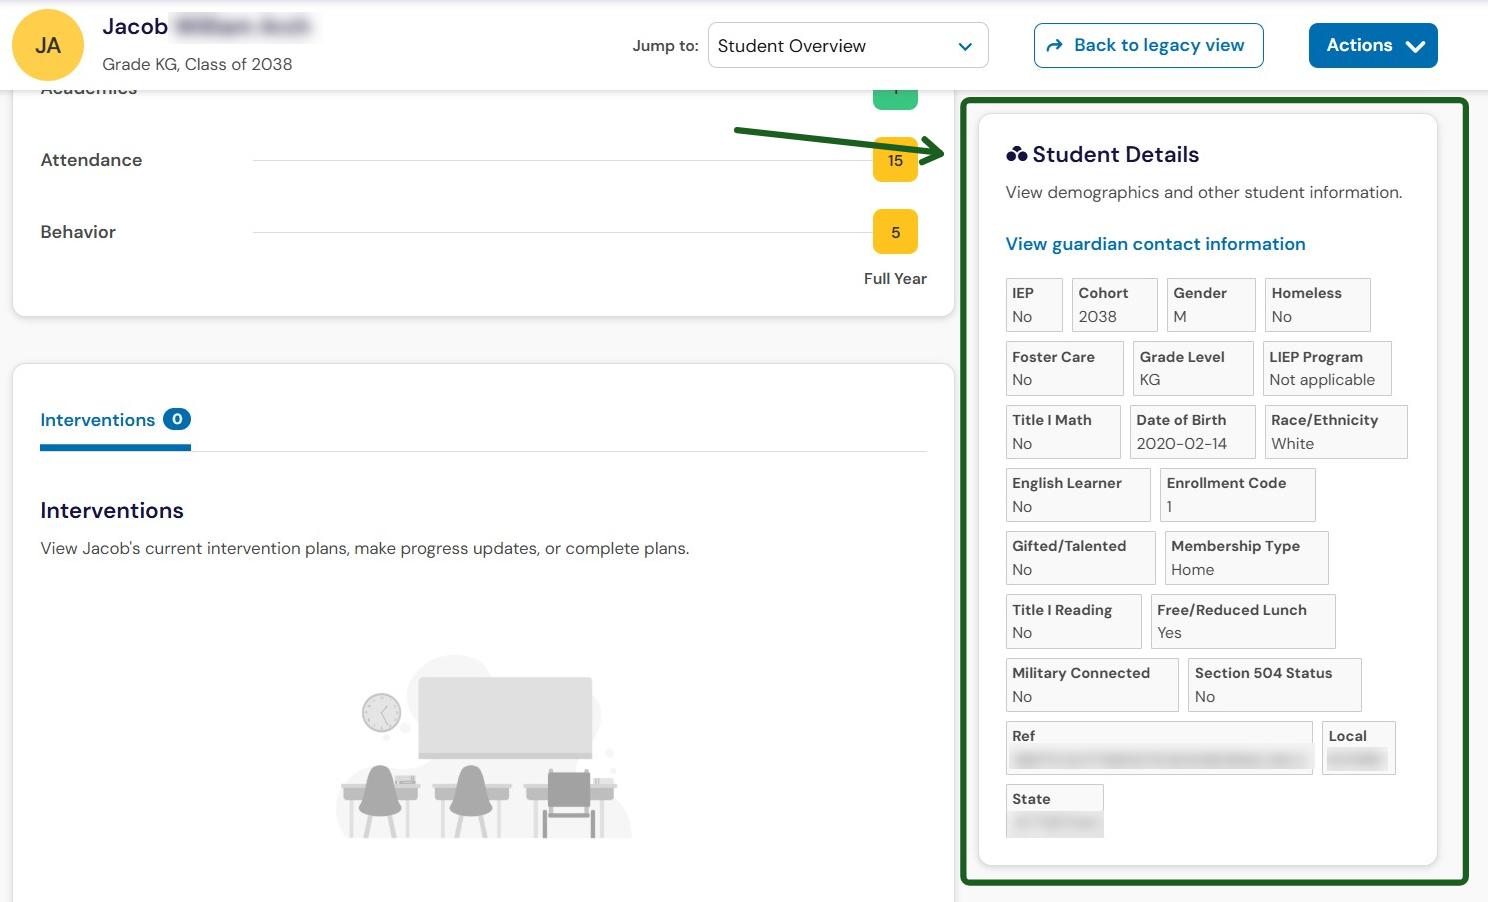
Figure 11
Please note: Guardian contact information is not available for Iowa.
Intervention Plans and Referrals
As you scroll down the Student Profile on the left, you will see the Interventions and Referrals section. This section displays any individual or group interventions as well as any student support referrals that have been created to support the student.
Interventions
Select an intervention to expand it and review key details, including the intervention goal, the educator leading the intervention, and recent progress updates. This helps you understand what supports are in place and how the student is responding.
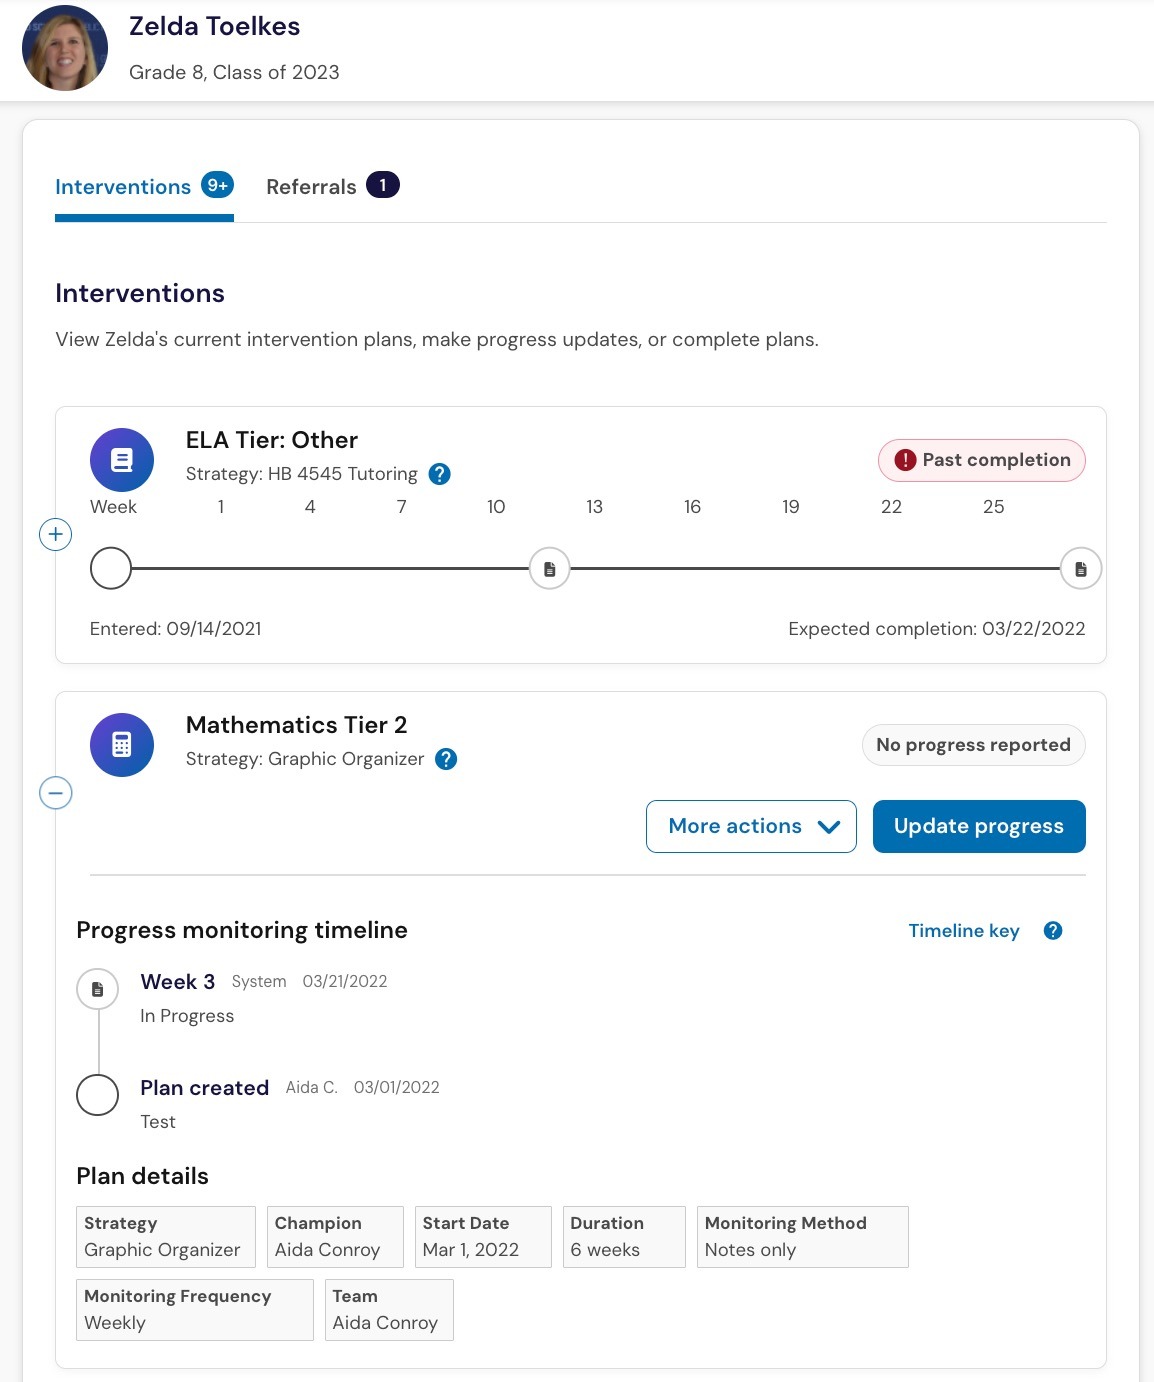
Figure 12
In the intervention section, educators are able to:
View active and past interventions for the student.
Monitor progress through ongoing updates.
Add support notes related to the intervention.
Create, refer, or update interventions, depending on role and permissions.
Teams often use this section to coordinate support and decide whether to continue, adjust, or fade an intervention.
If you'd like to add an intervention plan for a student, you can do so by clicking the Actions button at the top of the page and selecting "Create intervention plan" on the dropdown menu in the upper right corner of the student’s profile page..
Academics
The Academics section brings together course grades and assessment data to show how a student is progressing across courses and assessments.
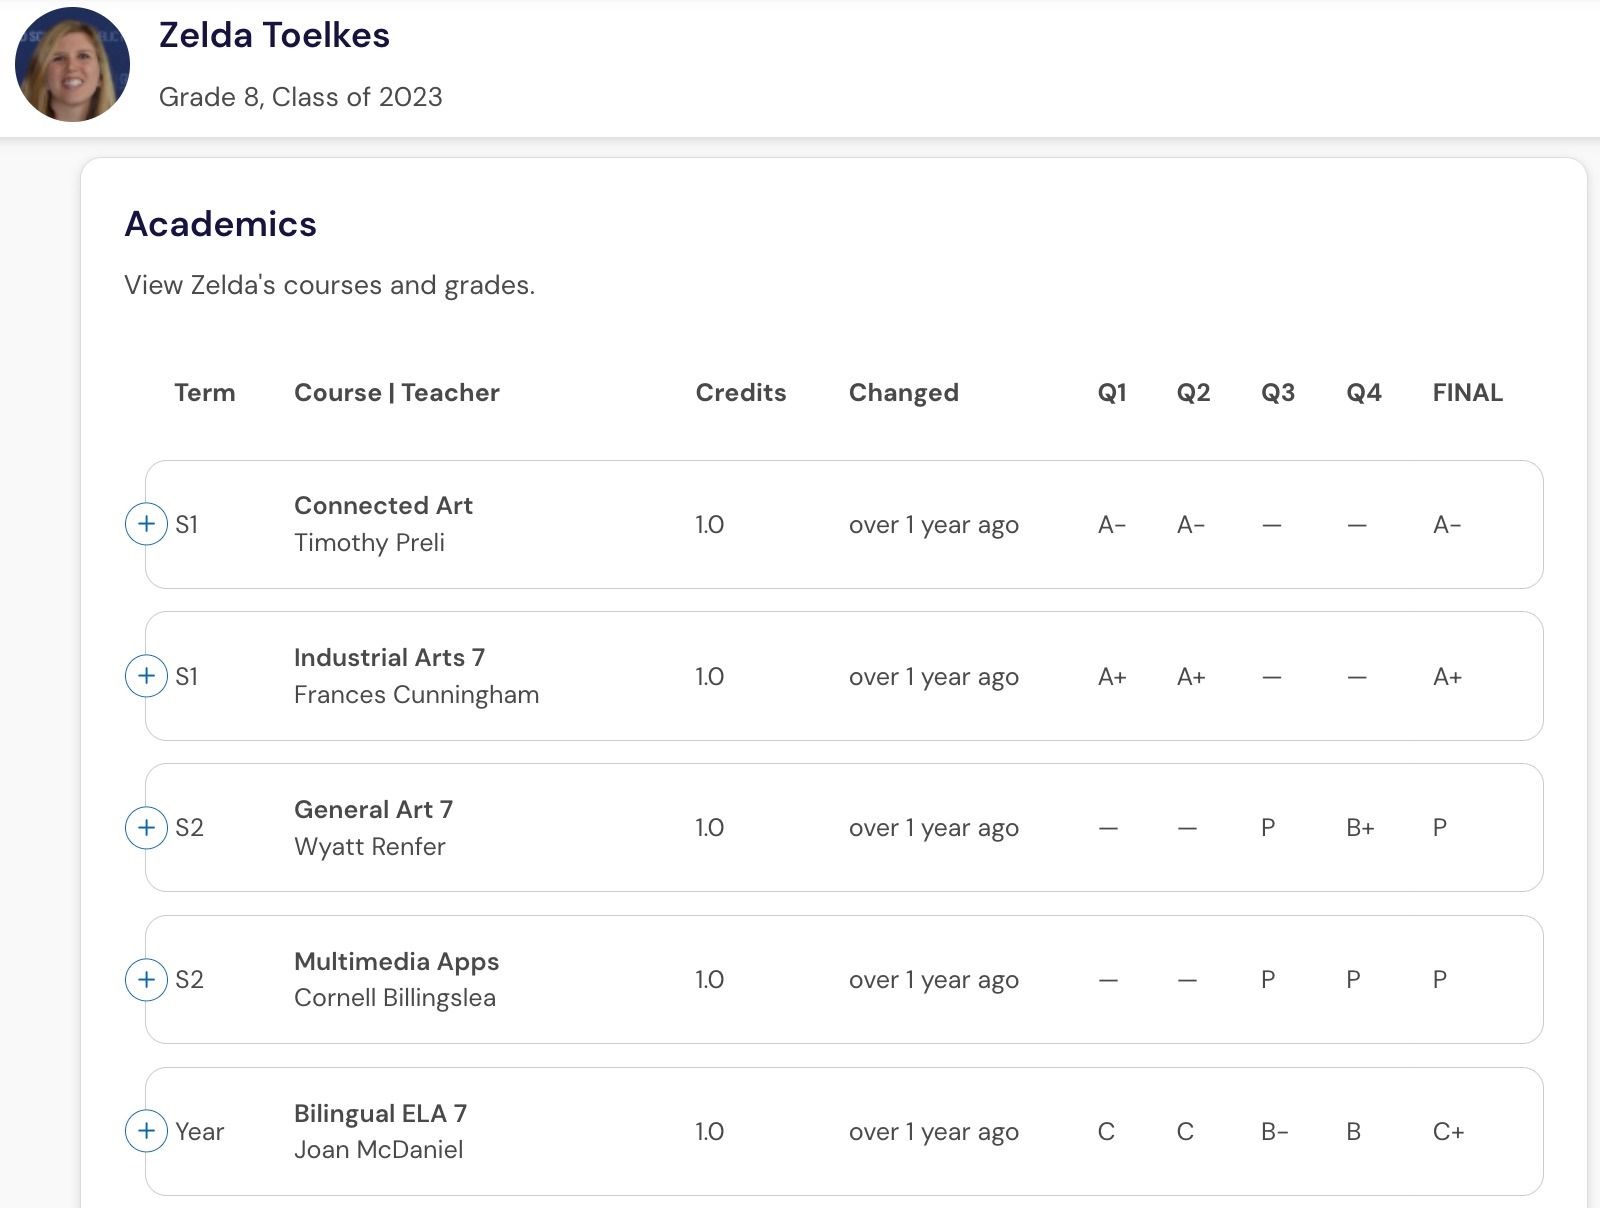
Figure 13
Grades appear by course and marking period, making it easier to spot trends over time.
Courses appear in the Academics section when the student is enrolled in the course, and at least one grade has been recorded. The most recent grades are highlighted to make trends easier to spot.
Select a course to expand it and review additional details, such as changes over time and standards-based grades, when available. Educators often use this view to identify areas of strength and where additional support may be needed.
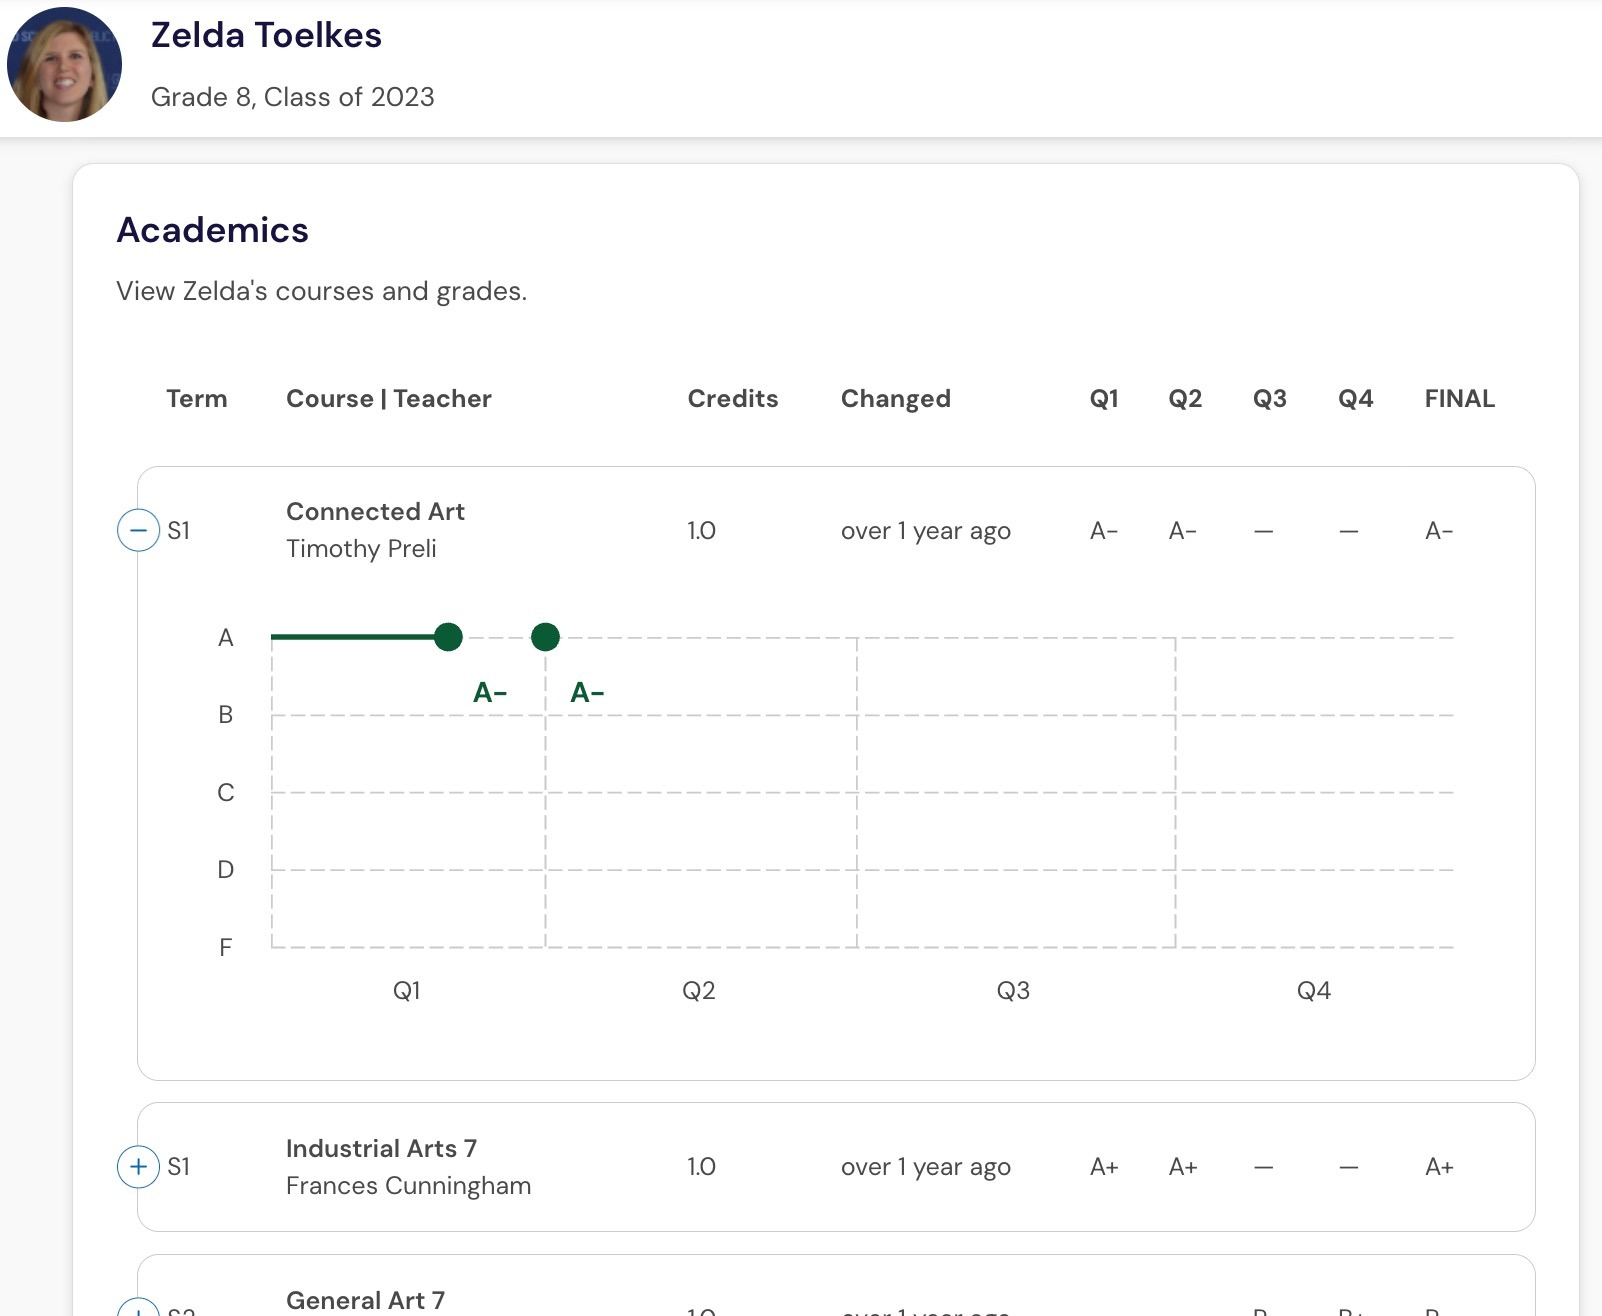
Figure 14
Assessments
Below course grades, you can review assessment results for the student, including YTD progress monitoring results.
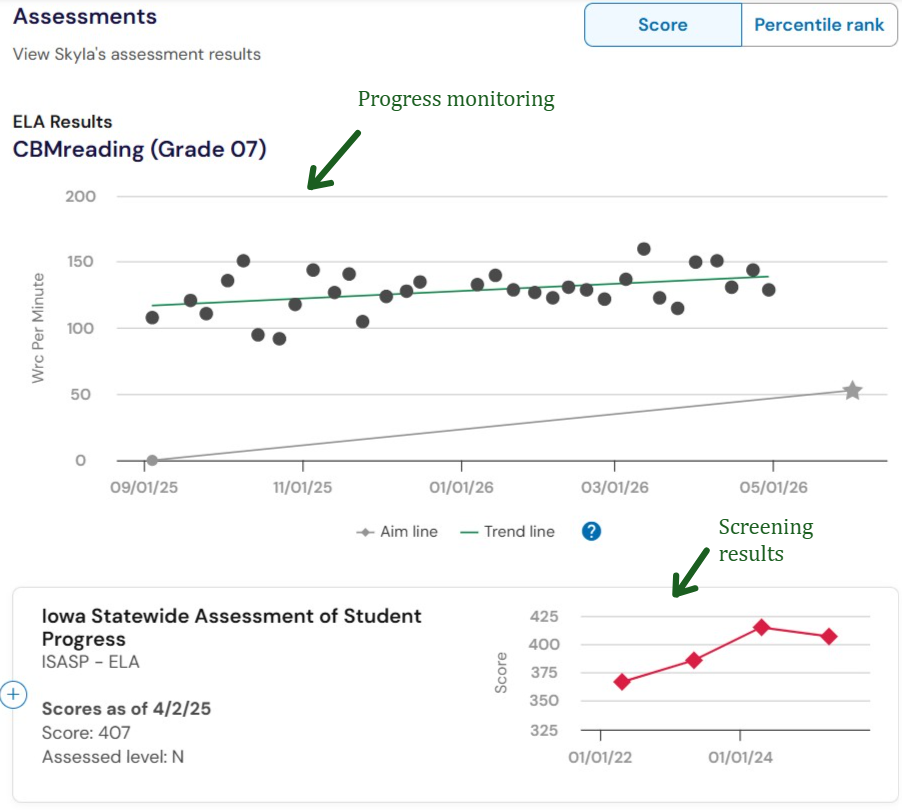
Figure 15
Click the + to expand and display additional details about the assessment such as errors or subtest scores, depending on the assessment. Line graphs display progress over time for each assessment, which helps educators identify growth, patterns, or areas of concern. Depending on the assessment, results may appear as percentile ranks or raw scores.
Attendance
The Attendance section provides both a summary and a detailed view of attendance patterns. At the top of the section, you can review a summary of attendance information, such as year‑to‑date attendance and recent attendance percentages. Below this you will see a calendar view showing daily attendance details.
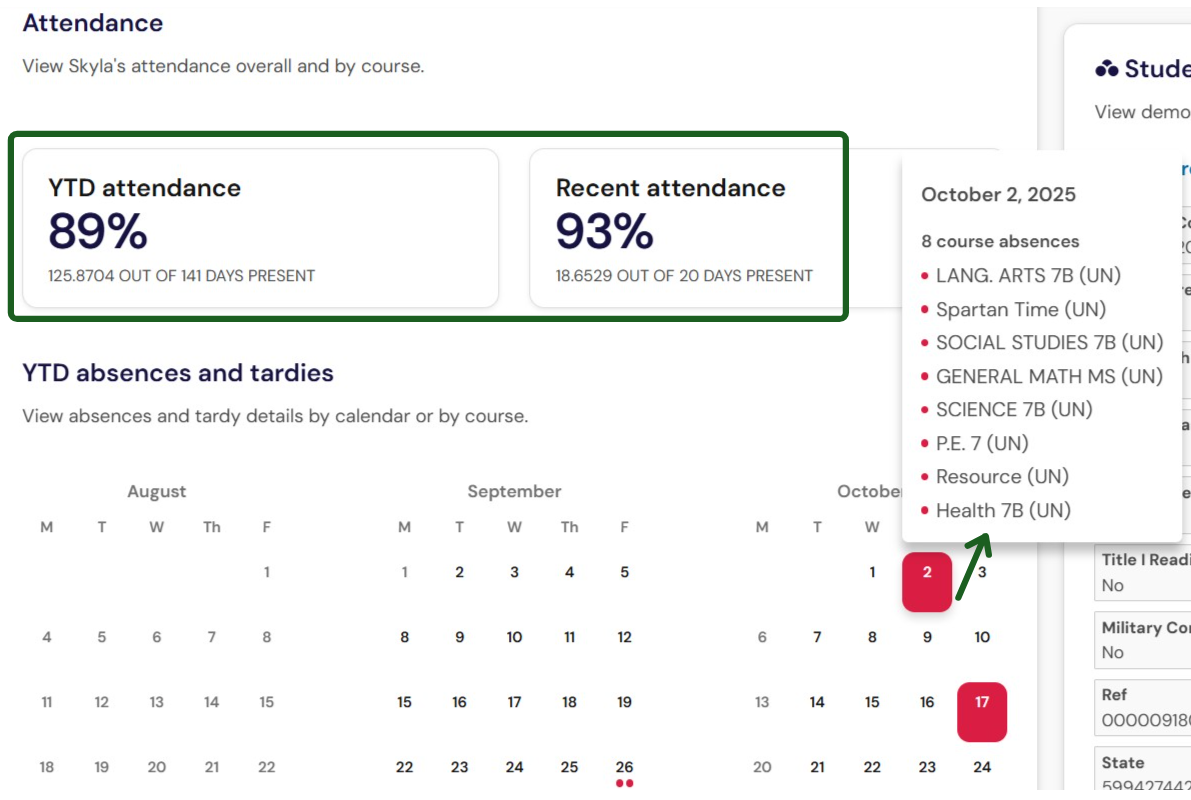
Figure 16
The calendar view displays daily attendance over time. Color-coding makes it easy to identify patterns such as frequent absences or recurring tardies.
Hover over a day on the calendar to view a brief summary of that day’s attendance, including course absences, tardies, or full-day absences.
You can use the chart below the calendar section to understand how attendance appears in the calendar view. Some data elements may be tailored to your specific district's configuration. However, the legend is available to guide your interpretation of the data if your district made any customizations. Further down, you will see more detailed information about the student's attendance by course section.
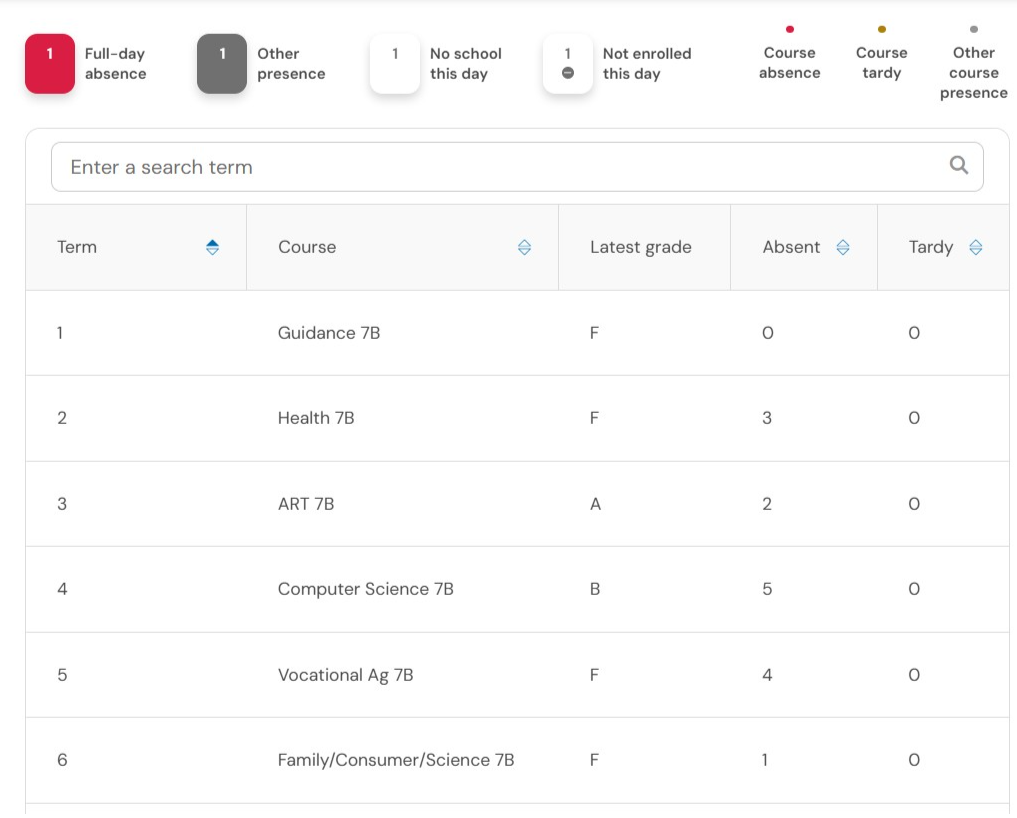
Figure 17
Behavior
The Behavior section summarizes recorded behavior incidents and outcomes. At the top of the section, you see a high-level summary that helps you understand overall behavior trends such as the number of incidents, behavior types, and outcomes.
A list of each incident will be provided, which can be expanded to display additional details. These details include the behavior type, severity, location, outcome, and the individual who reported the incident.
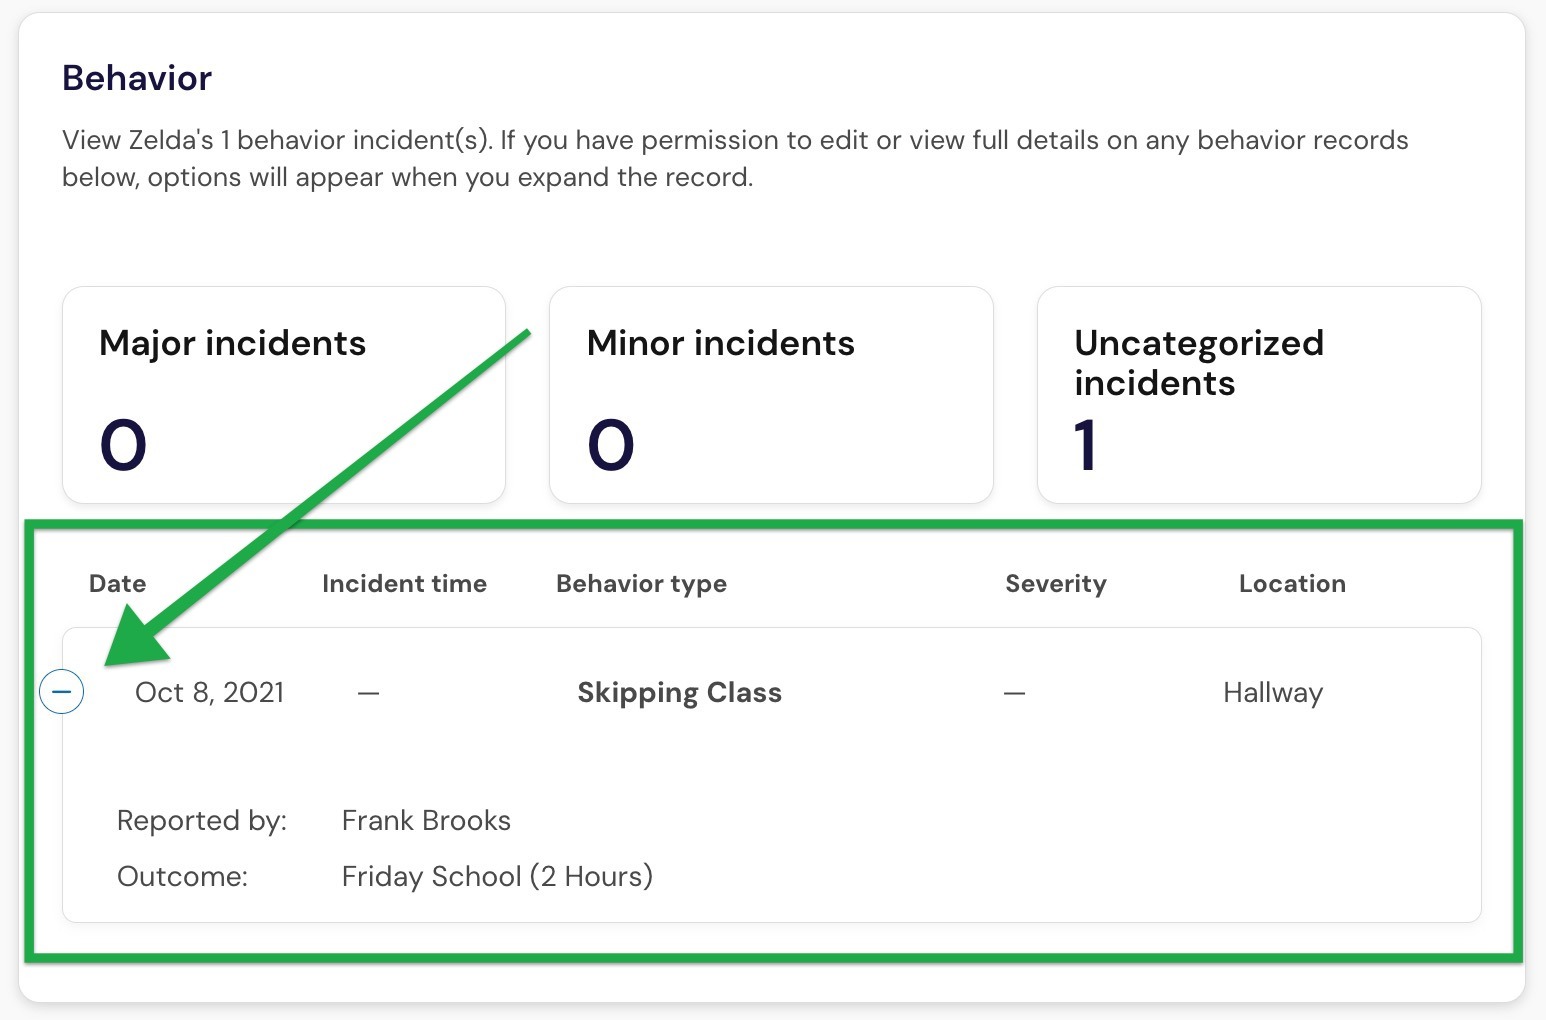
Figure 18
Exploring the new student profile page webinar
Recording:
https://panoramaed.wistia.com/medias/4jj65lz4yv
Slide Deck:
https://docs.google.com/presentation/d/1lpByEroLoJazcFw9YDc0HNiMH0sFTLI8VYuofKLlM2I/edit?usp=sharing