Preview of 25-26 Navigation and HI Report Changes
Last updated: July 1, 2026
Preliminary designs only
The views you will see in this article and video are close to final, but may change before they are fully released
We are sharing them to give people an advanced organizer
This is not intended to be training on the new system
All the reports are familiar, just navigation changes and the addition of a new landing page
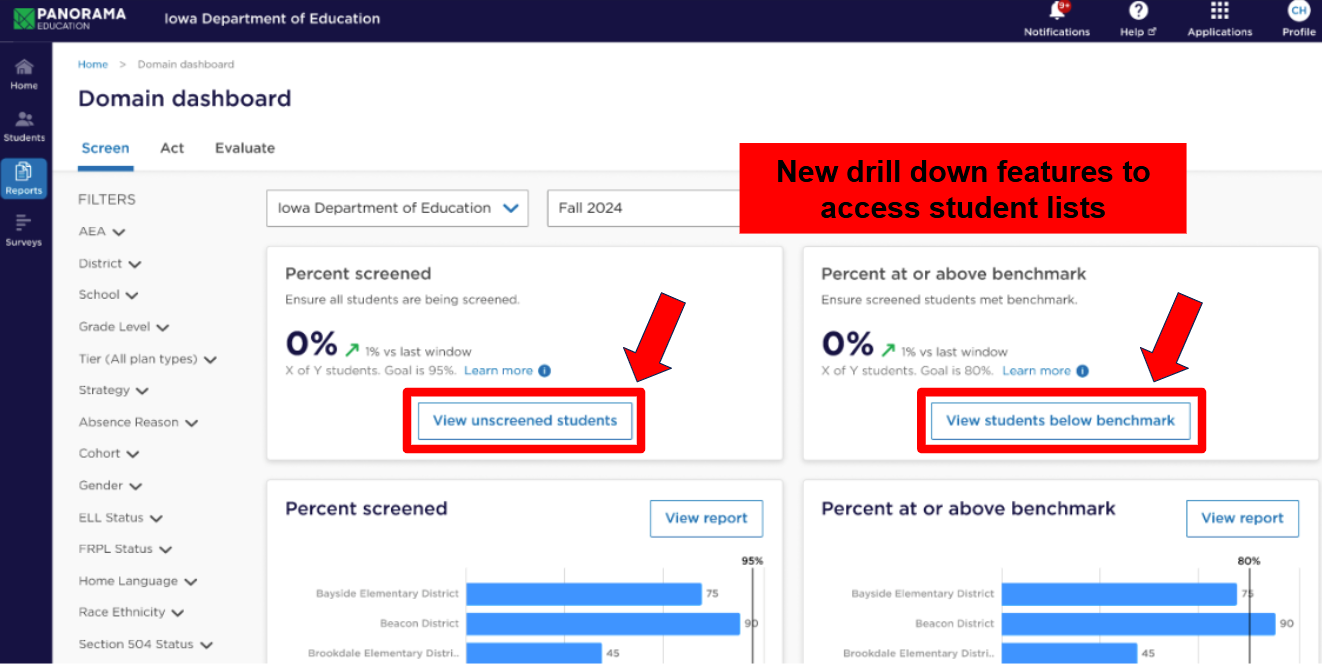
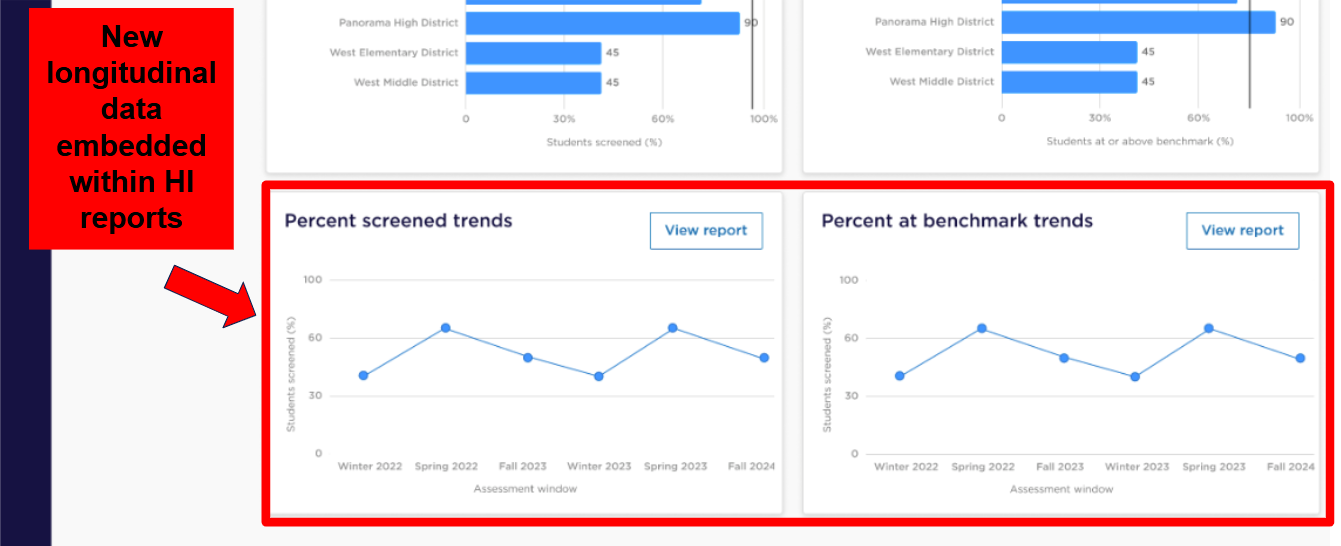
Healthy indicator reports will have a new appearance, new technology behind the scenes driving the reports, and more features
One new HI report replaces the old HI#2 - progress monitoring
👤For preview only Please note that there could be differences between the preview images shared below and the final published product. |
Anticipated release date: early September 2025
Same | Different |
These HI report metrics don’t change:
Data sources and operational rules are not changing | New HI #2 will summarize student growth toward intervention goal New reporting engine will change look and feel of reports (a bit like the new Chronic Absenteeism Dashboard) Will include HI indicators over time, not just snapshot of one at a time Will support drill-through to student level data |
New landing pages
District user landing page
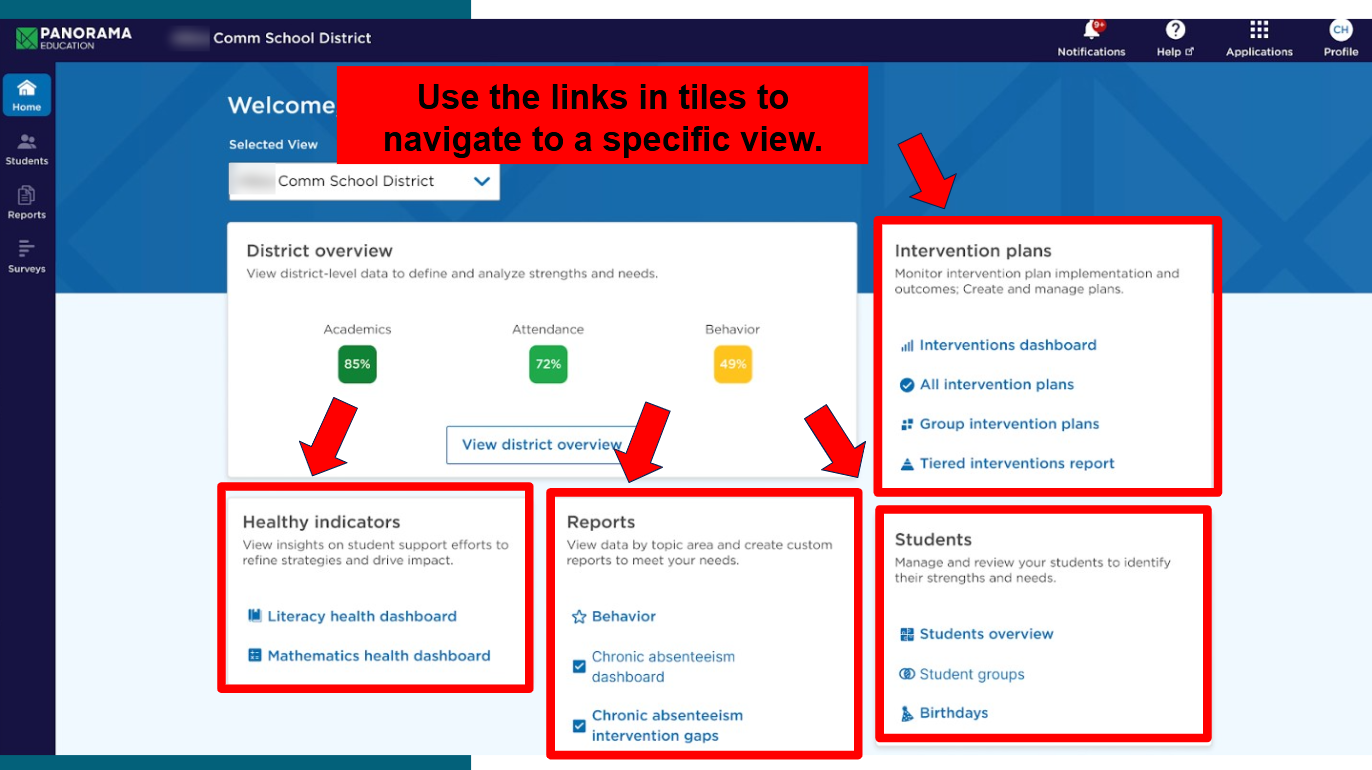
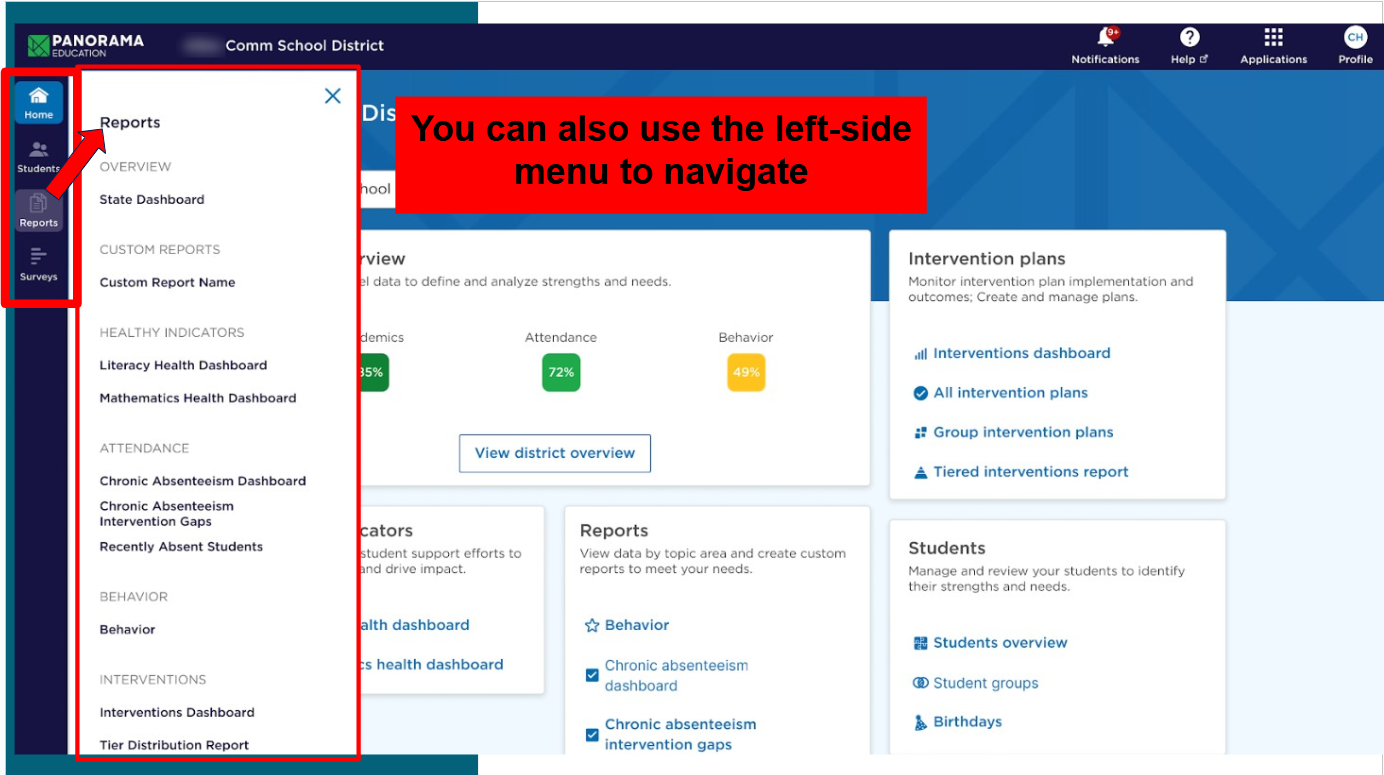
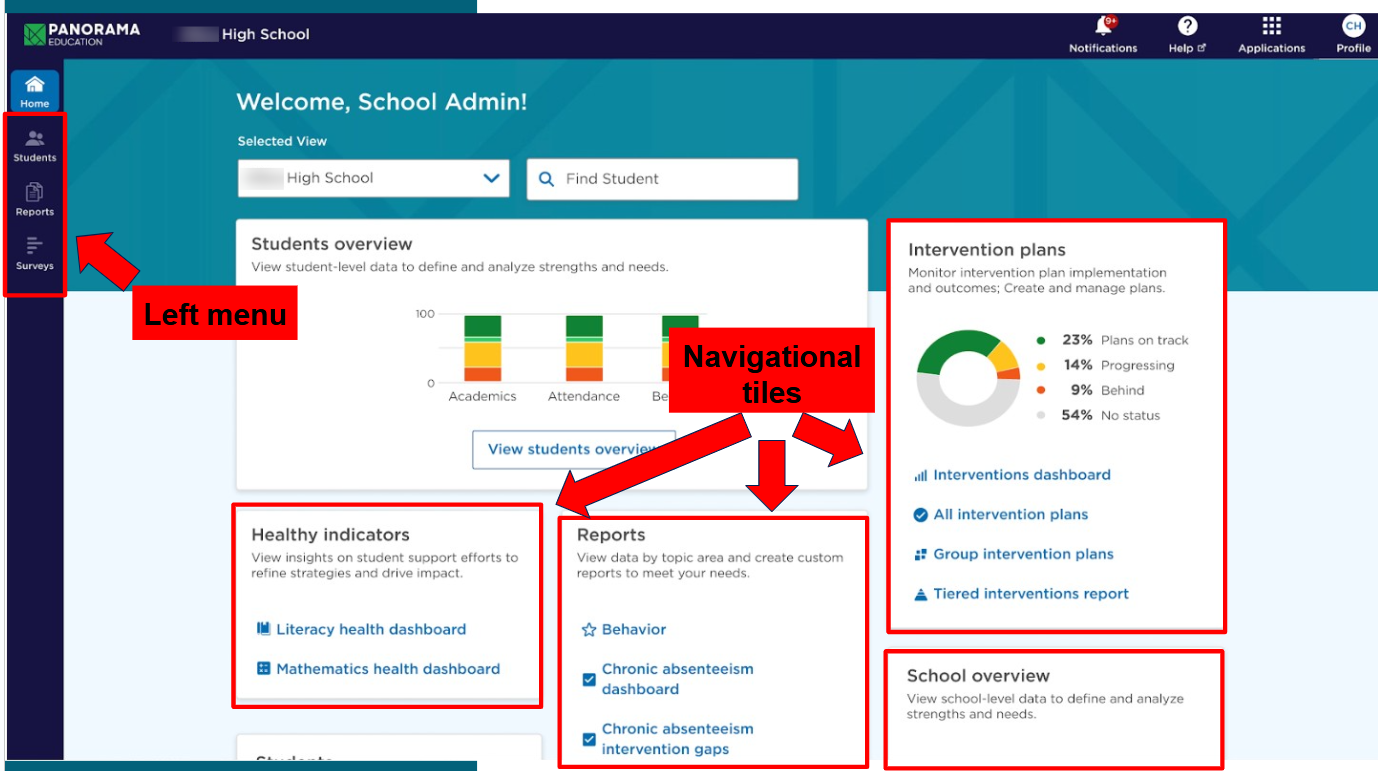
The landing page will have many familiar elements and reports accessible with a few clicks. There are two ways to navigate to different views from the new landing page.
Tiles containing links to the views
Collapsing menu on the left
Building user landing page
Each user landing page will have permissions-specific tiles and menu but the same general layout.
Sneak peek at 25-26 Healthy Indicator Reports
📋Reminder These are draft views and final functionality may be slightly different from the sneak peek. We will have more details and training when the reports are ready to deploy. This is just a teaser! |
Same | Different |
These HI report metrics don’t change:
Data sources and operational rules are not changing | New HI #2 will summarize student growth toward intervention goal New reporting engine will change look and feel of reports (a bit like the new Chronic Absenteeism Dashboard) Will include HI indicators over time, not just snapshot of one at a time Will support drill-through to student level data |